SSD Capacity Scaling Across 5 SSD Models
Comparing how drive performance scales across different capacities of the same drive.
One of the topics I’ve touched on a bit in my previous reviews — which I’ve been meaning to dive into more deeply — is the concept that SSD performance for a given model generally scales with capacity. In this review I’ll illustrate just that. I’ll be running 5 different SSD models with two different capacities per model through my standard suite of performance tests.
The idea is that smaller capacities have less NAND parallelism due to having fewer NAND dies and/or NAND packages on the drive. As with many things, there are definitely exceptions to the rule most notably, some drives use different densities on NAND for different capacities, yielding the same level of parallelization across different capacities. For example, a 128GB SSD may use 16x8GB dies and a 256GB model might use 16x16GB dies. Some less common drives even lose performance at their highest capacity due to there being more NAND than the controller can address simultaneously, leading to accesses having to alternate between groups of NAND packages rather than accessing all of it at once.
Depending on the characteristics of the SSD’s controller (such as the number of channels and the NAND interface speed) and the density of the NAND used on the drive, diminishing returns tend to kick in at different capacity levels. Generally, higher end controllers will be able to support 8 channels of NAND whereas lower-end controllers tend to support only 4. As such, higher end controllers tend to continue to scale at higher capacities than smaller drives along with unlocking higher performance levels overall.
The 5 models tested in this review are:
- Toshiba XG6 - 256GB and 1TiB
- Samsung PM981a - 256GB and 512GB
- WD SN520 - 128GB and 256GB
- Samsung PM991 - 128GB and 256GB
- Kioxia/Toshiba BG4 - 128GB and 256GB
All drives are OEM M.2 PCIe NVMe drives. The XG6 and the PM981a are both high performance drives and the SN520, PM991, and BG4 are all entry-level drives.
With the exception of the PM981a, I’ve previously reviewed all of the drives in at least one of the two listed capacities. The 1TiB Toshiba XG6 I reviewed on its own, and the 128GB SN520, 128GB PM991, and both BG4s were reviewed in my initial SSD roundup: Compact M.2 SSD Roundup — Short But Sweet?. More details about each of these drives can be found in their respective reviews.
As for the PM981a, it is the OEM version of the retail 970 EVO. Performance is a bit different compared due to the retail drive due to less overprovisioning and slightly different firmware tuning, but the drives are otherwise relatively similar in terms of specifications and performance.
Review
This review is going to be a bit different than any of my previous reviews in terms of style. Instead of comparing the different models of SSD to each other (such as XG6 vs PM981a), I will largely restrict my commentary to the performance changes between different capacities of the same drive.
As the graphs comparing 5 pairs of drives are already pretty busy, I’m omitting all other competing drives, but if you’d like to compare the results to other drives I’ve tested, the numbers in this review are directly comparable to any of my other reviews with the “Methodology-v1” and “Testbed-v1” tags.
If you’d like to know more about my hardware setup as well as my testing methodology, check out my SSD Review Background, Setup, and Methodology v1.0 piece.
For what it is worth, this is the final planned review on Testbed v1.0, and my second-to-last planned review using Methodology v1.0. When I migrate to Testbed v2.0, I’ll run all drives that have been tested to-date through the Methodology v1.0 tests once more to demonstrate how performance differs on the newer platform before moving onto a revised Methodology v2.0 for future tests.
Write Test — Disk Fill Summary
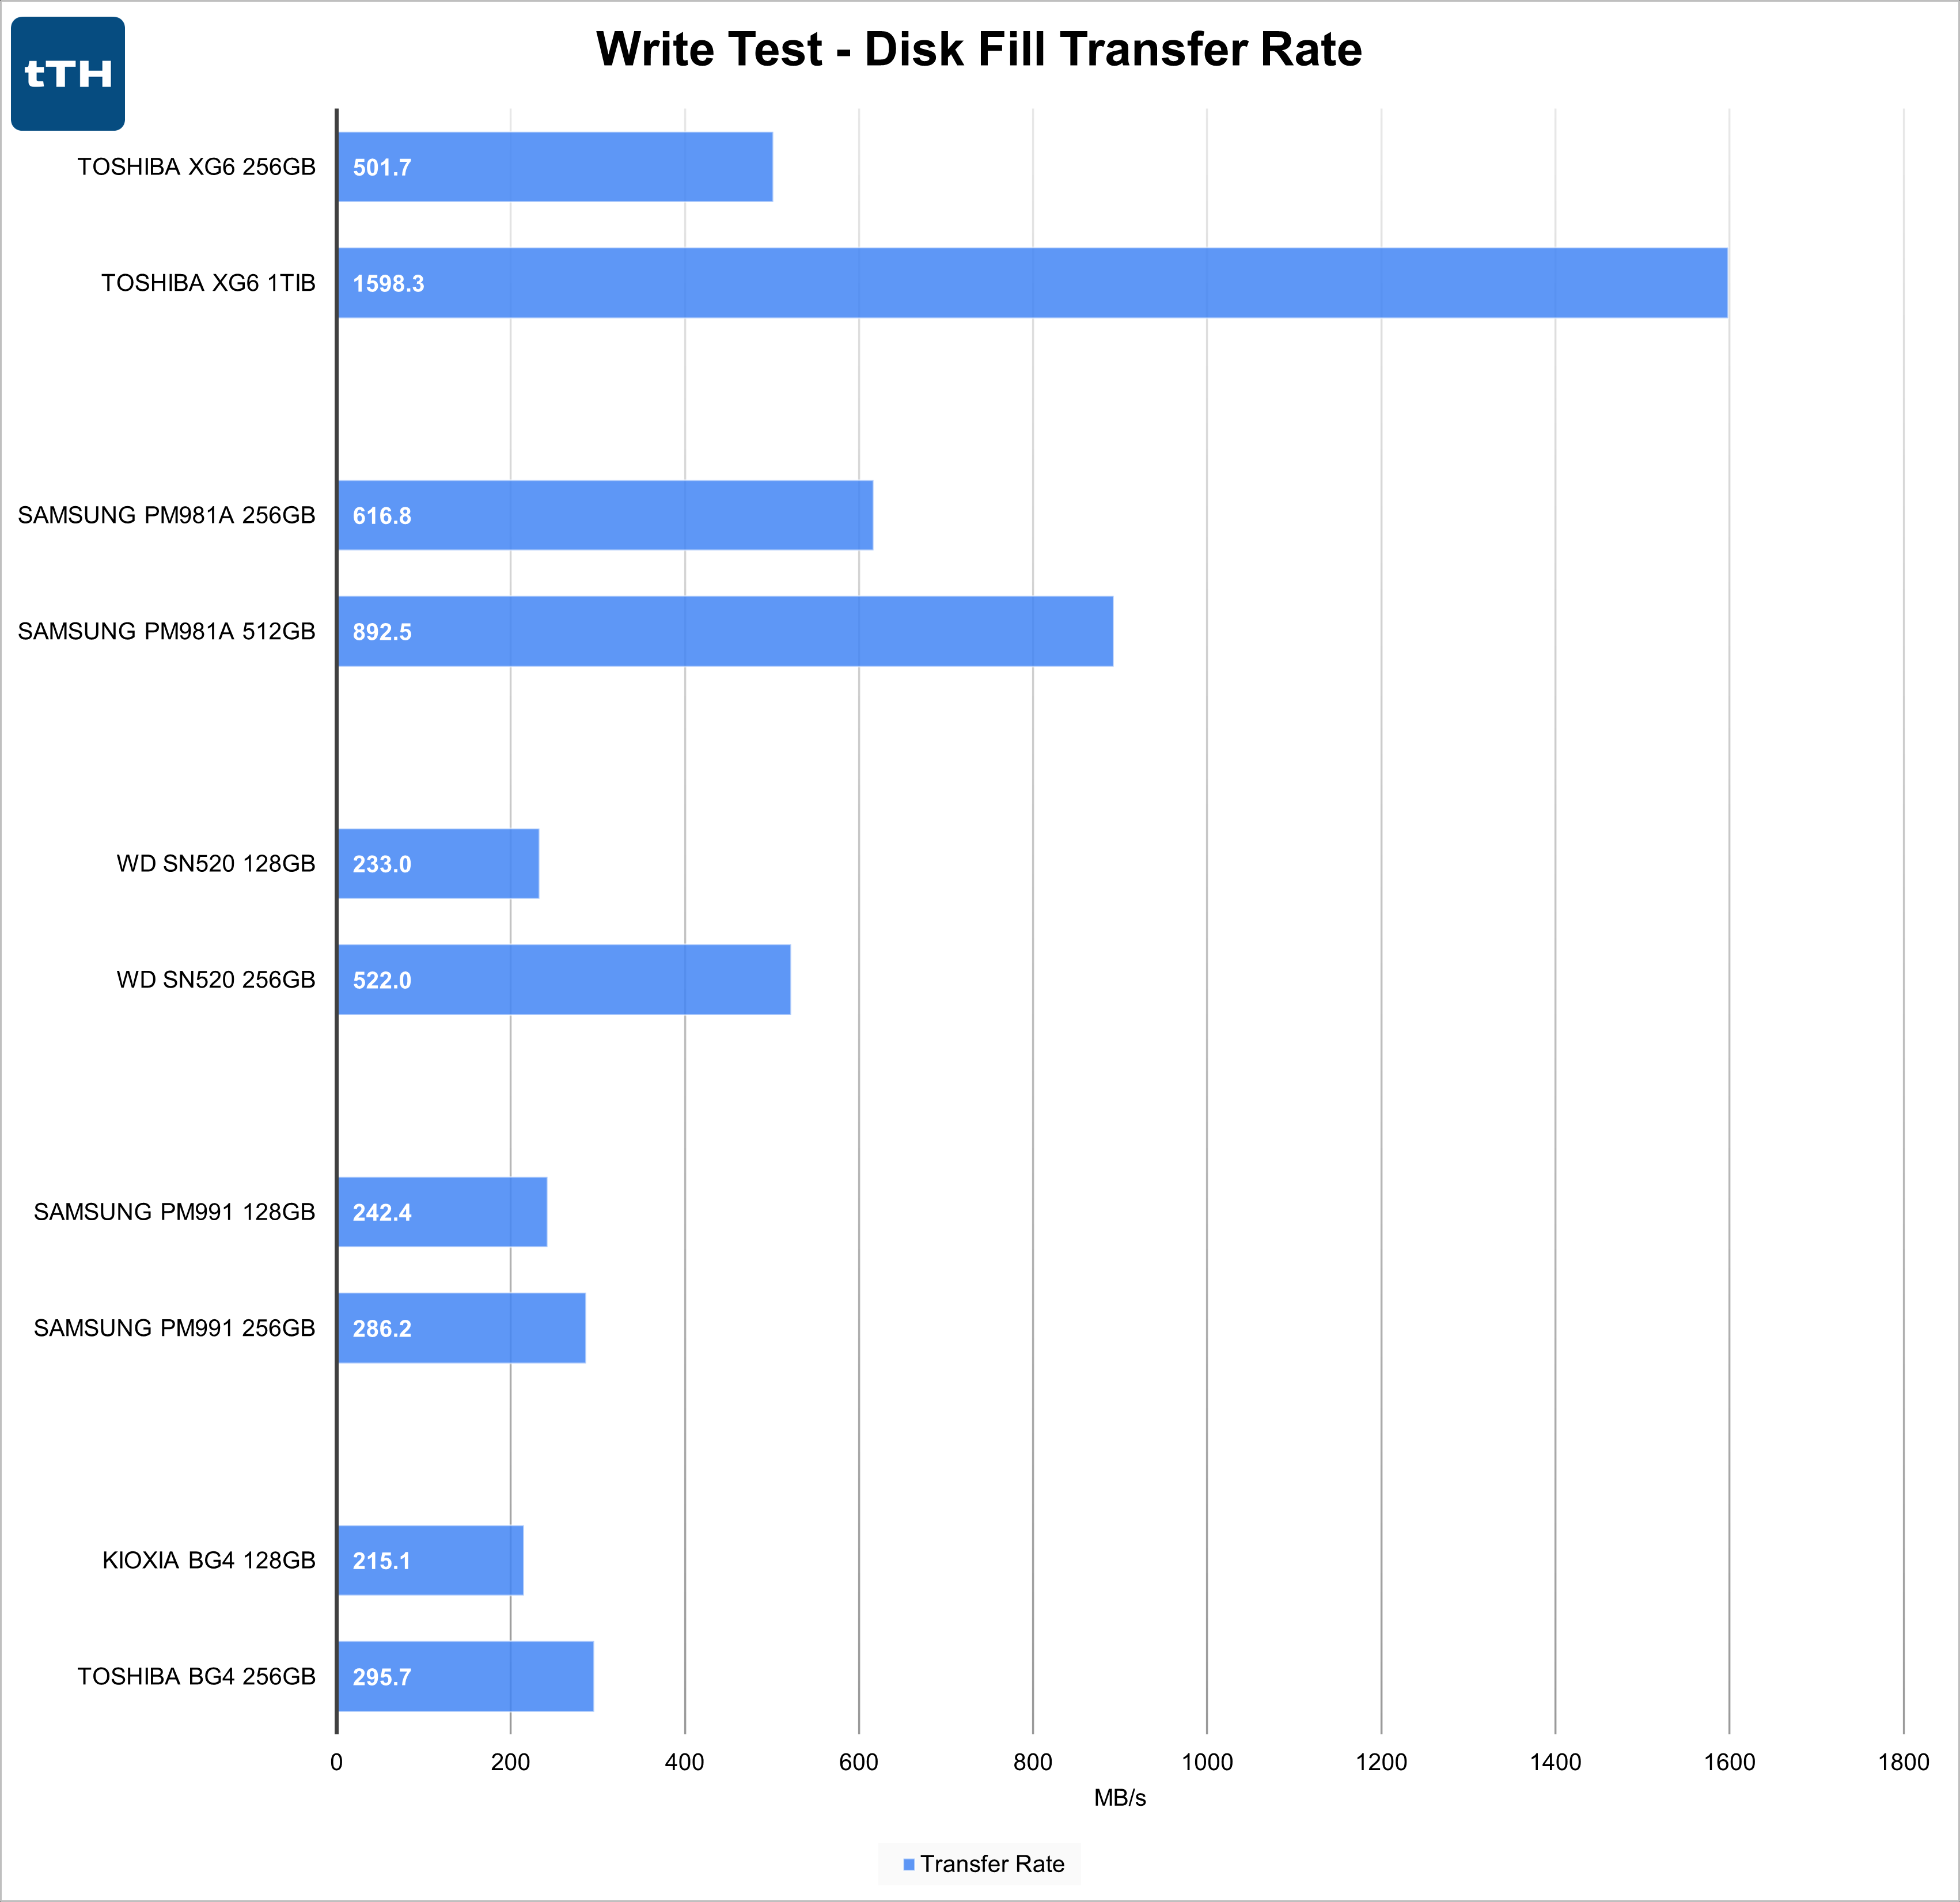 Starting off with the XG6, quadrupling the NAND results in slightly more than a 200% (3x) improvement in sustained write performance. A doubling of NAND increases performance by 45% on the PM981a, 124% on the SN520, a mere 18% on the PM991, and 37% on the BG4.
Right away we can see that the drives are not all going to scale the same as their capacity is increased.
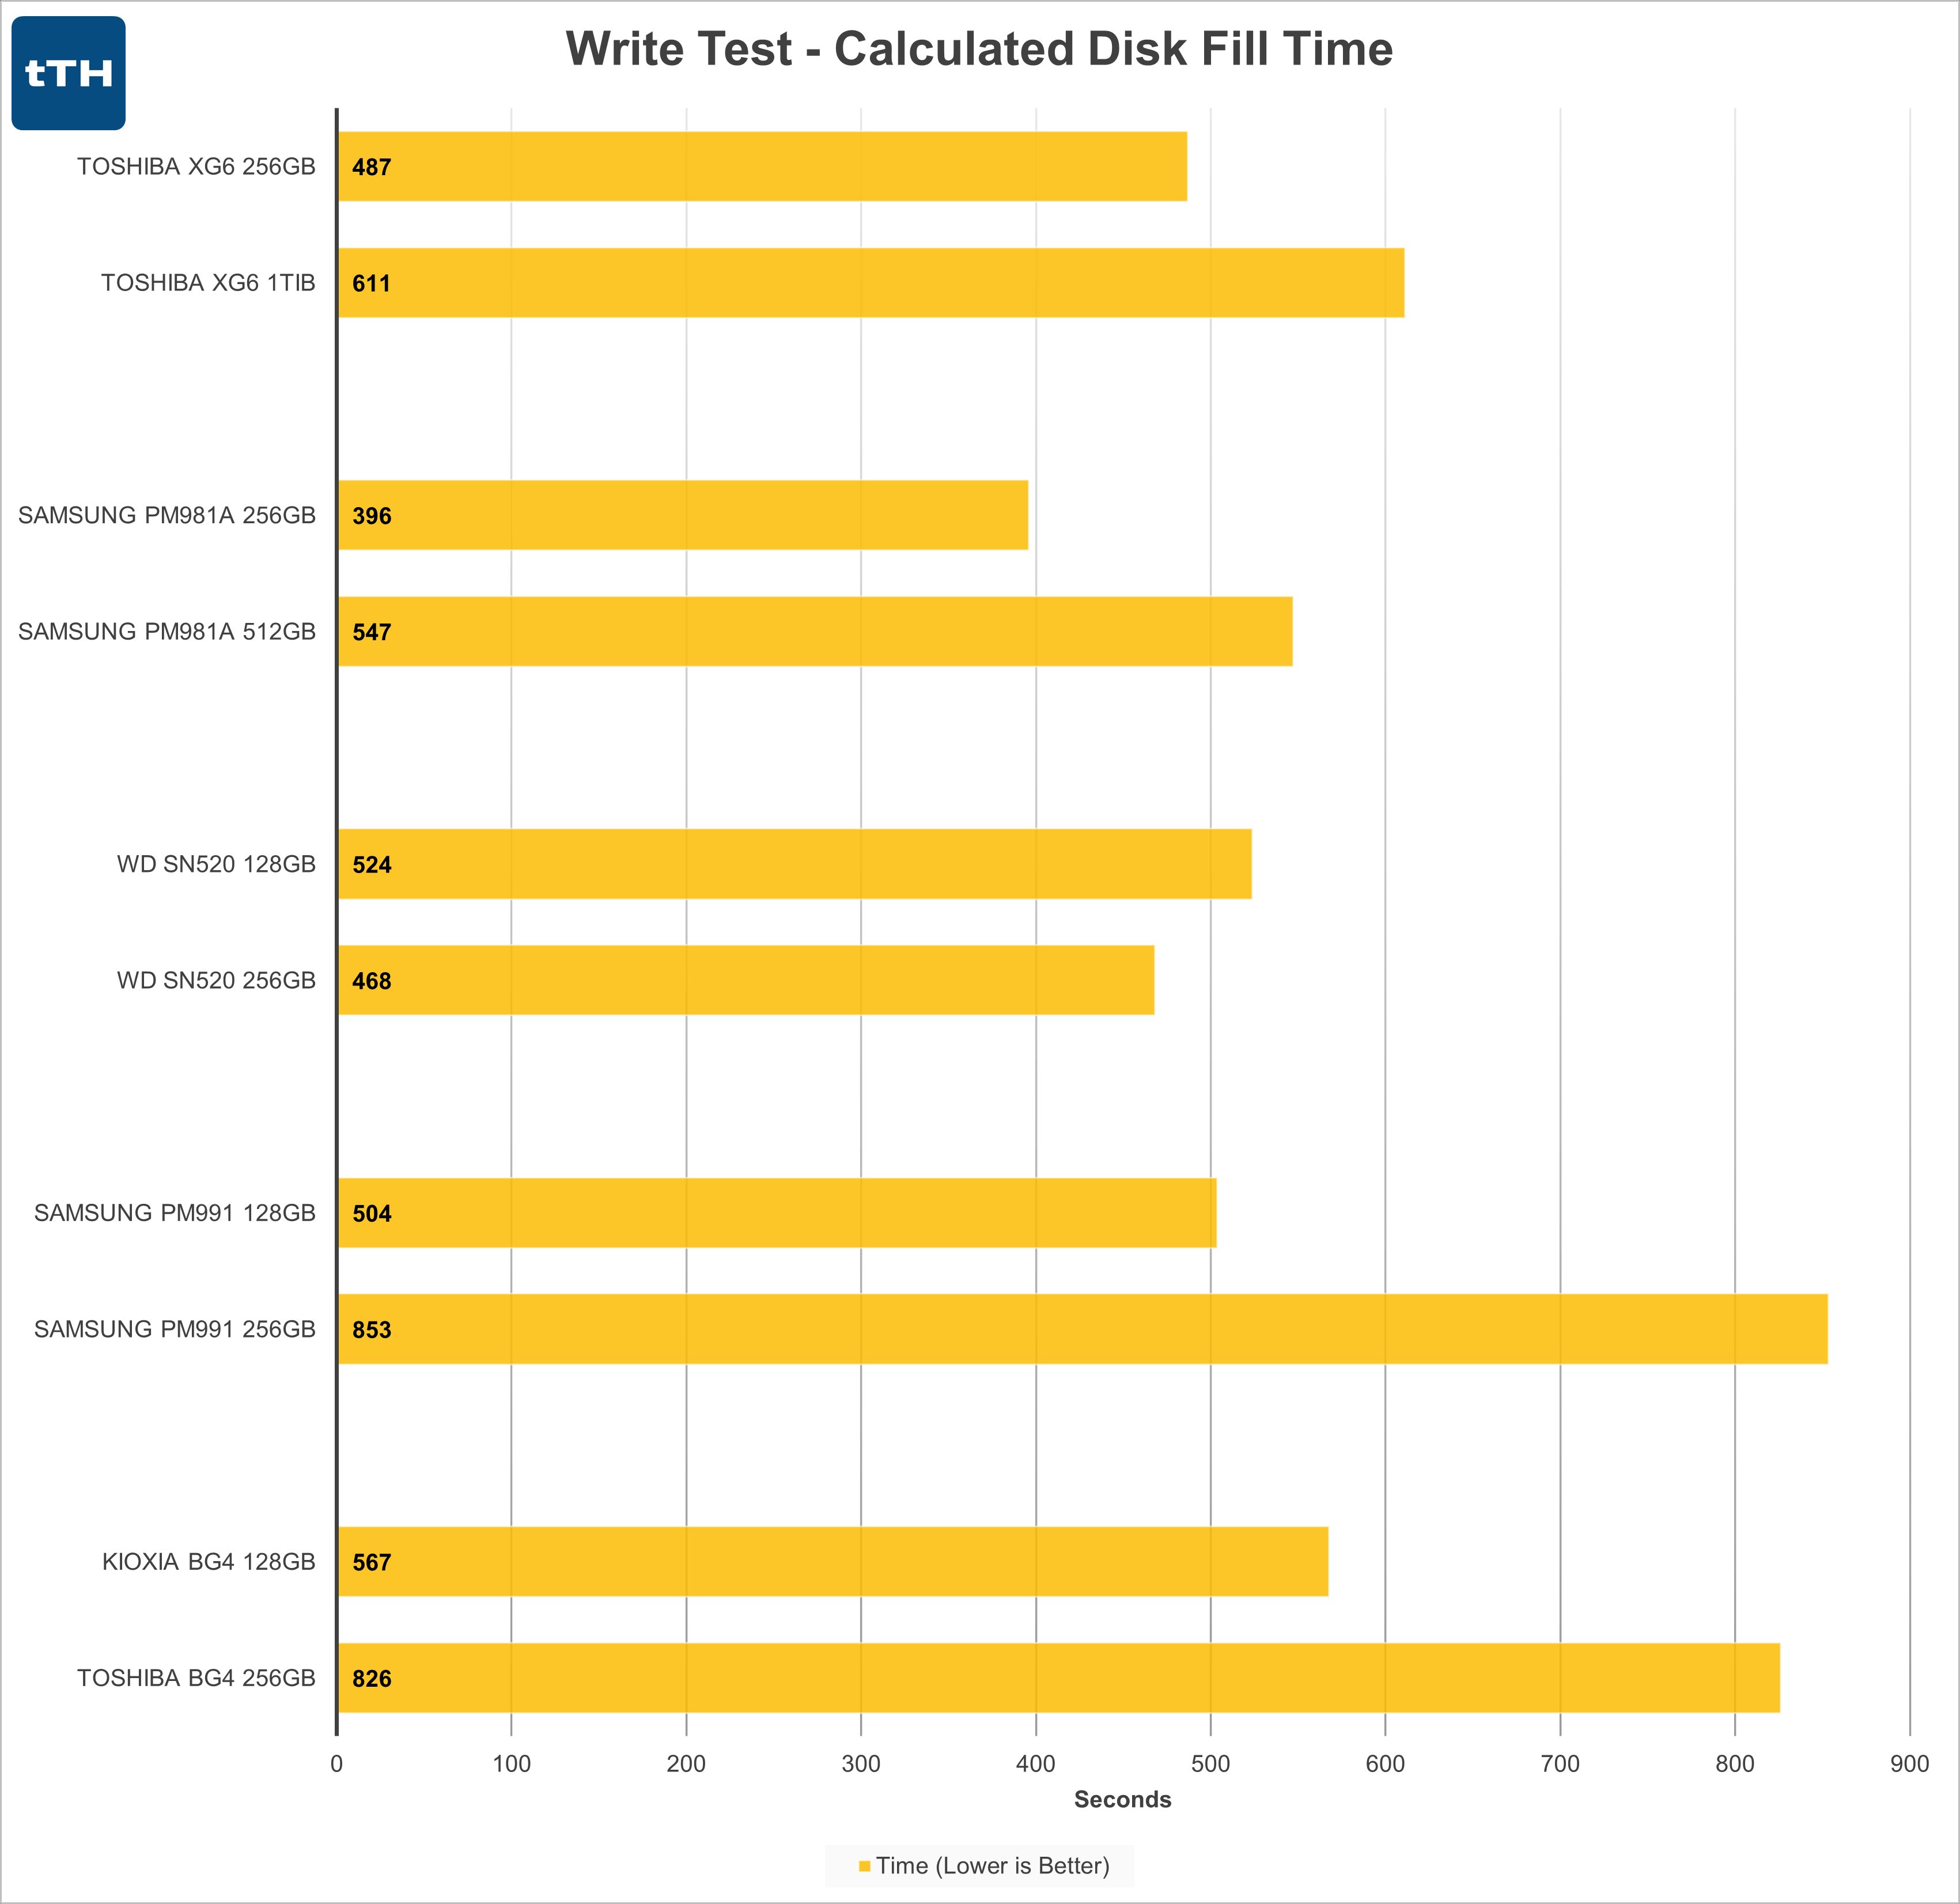 For all but the SN520, we see total disk fill times increase on the larger drives as the performance increases are outpaced by the capacity increases.
The SN520 shines somewhat in this regard, demonstrating greater than linear performance scaling, though this is a bit of a hollow victory because although the larger SN520 outperforms the other low-end drives, it is easily outpaced by the higher-end 256GB PM981a.
Write Test — Disk Fill Plot (per drive)
Before diving into the graphs, please note that the vertical axes are autoscaled differently for each drive by the benchmark software. This makes direct comparisons by just looking at the graph a bit more challenging. For future reviews I’ll capture the raw datapoints and generate my own graphs so that I can control the y-axis.
Toshiba XG6
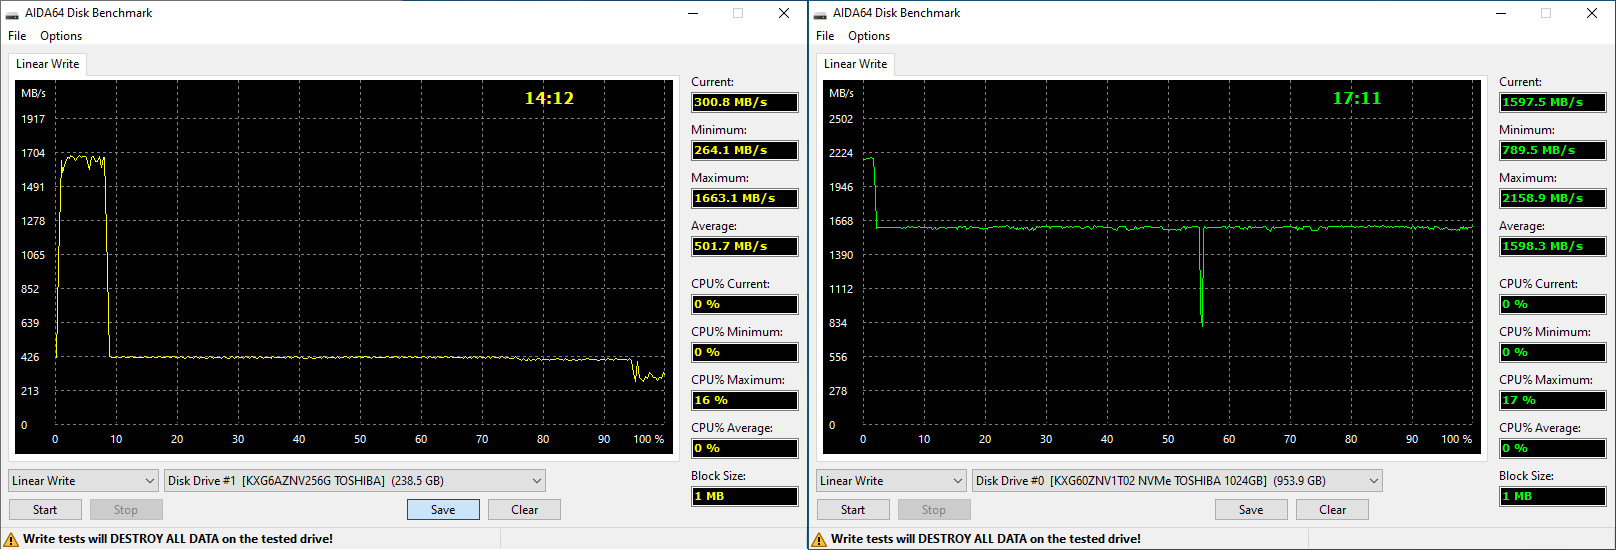 Starting off, the 1TiB and 256GB variants of the XG6 have moderately different performance profiles. The 256GB drive peaks at around 1700MB/s before falling to a steady 400MB/s after about 20GB of writes. The 1024GB model peaks above 2100MB/s, but despite the drive having over 4x total NAND on-board still seems to only have ~20GB of SLC cache. Still, sustained performance is over 1600MB/s, returning a nearly linear performance to capacity ratio for non-cached writes.
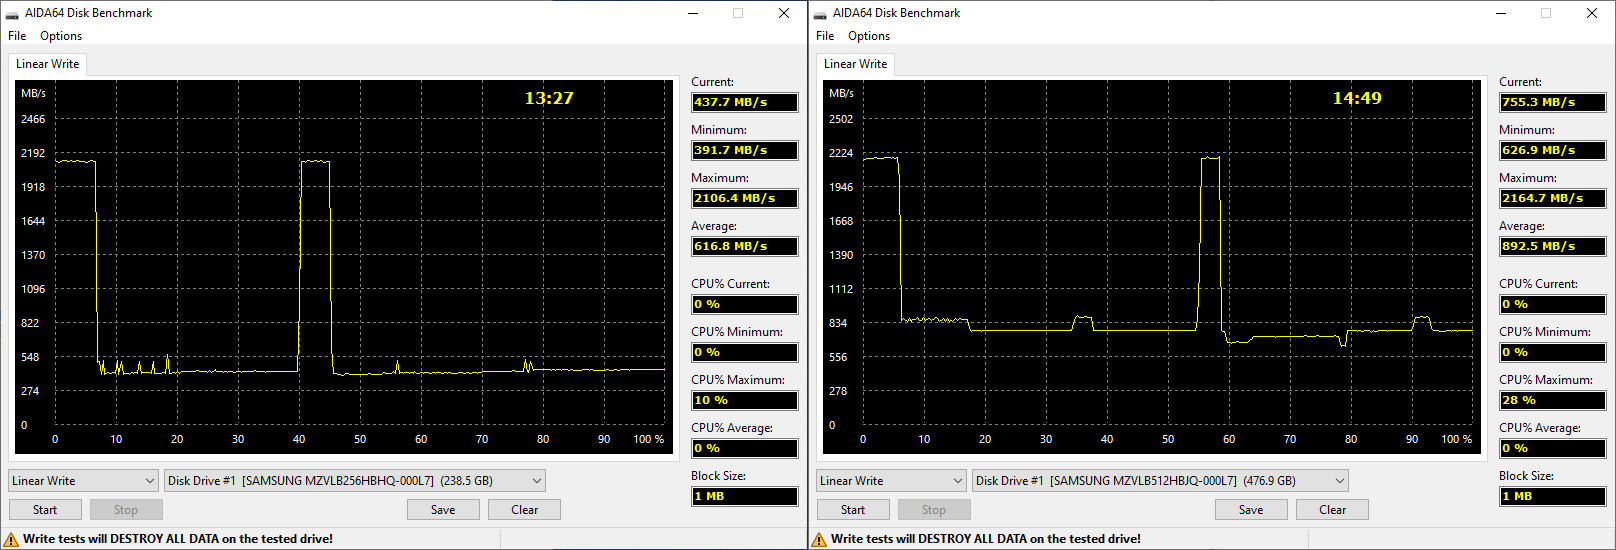 Both capacities of the PM981a start off with strong peak write performance and demonstrate reasonably large SLC cache capacities. After the write cache is exhausted, the 512GB model, with 3x the NAND is able to maintain approximately 800MB/s writes while the 256GB model drops to about 400MB/s.
Both drives experience a brief performance recovery to peak write speeds about half way through the test before falling back to their lower sustained performance levels.
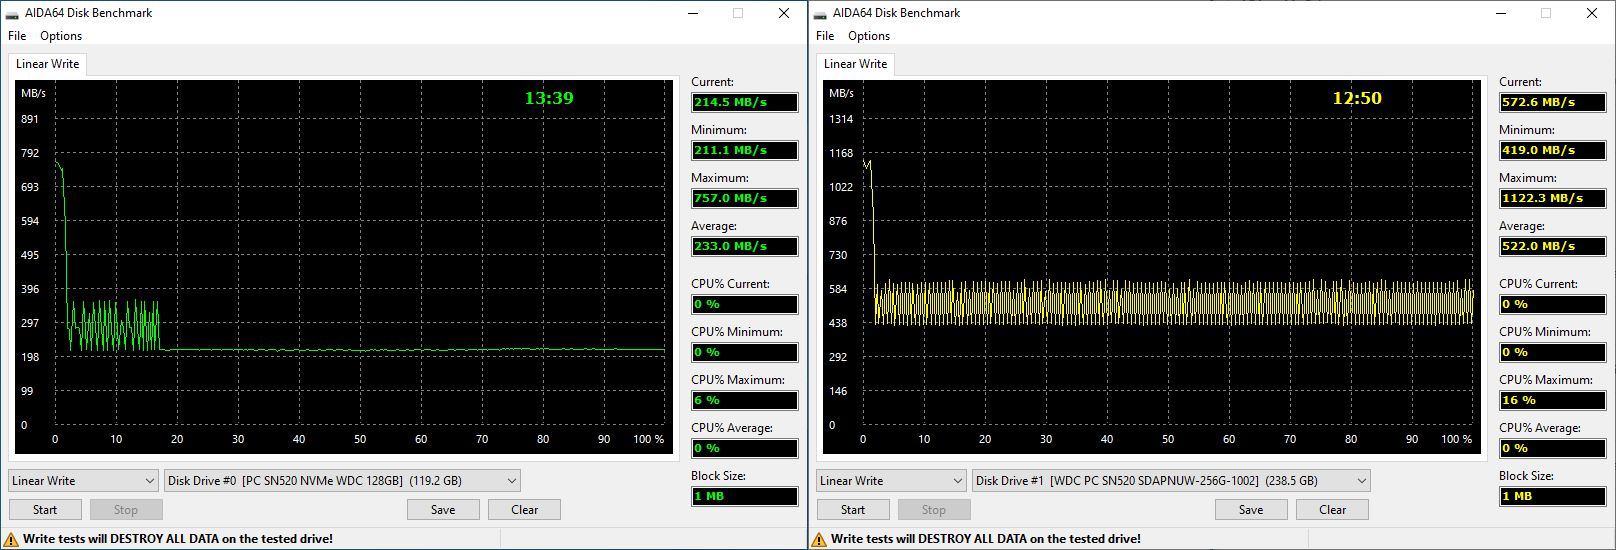 The graphs for the SN520 show much smaller SLC caches and lower performance overall - not unexpected for a lower-tier drive.
The 128GB model briefly peaks at just over 750MB/s before bouncing between 200MB/s and 350MB/s for about 20GB before settling at just over 200MB/s for the remainder of the drive’s capacity.
The 256GB model dedicates a similar percentage of its total capacity to SLC cache as its smaller sibling, but due to the additional NAND is able to sustain faster peak as well as sustained write speeds. Peak speeds exceed 1100MB/s and
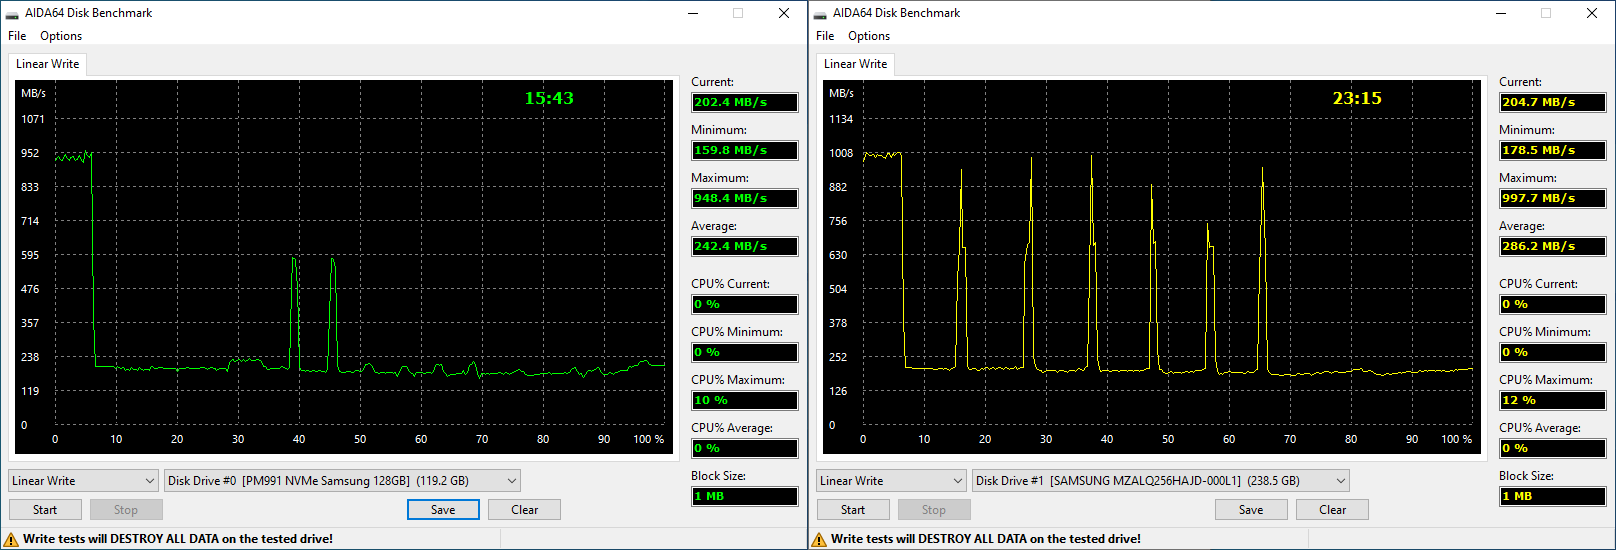 Both capacities of PM991 seem to dedicate ~8% of their capacity to SLC caches, so the larger capacity drive will be able to absorb more high-speed writes before falling to native TLC write speeds. And fall they sure do. After exhausting the SLC cache the 128GB model falls to about 160MB/s with a few short peaks back up to almost 600MB/s in the middle.
The 256GB model doesn’t fare much better. Its peak and sustained write speeds aren’t much faster than it’s 128GB sibling, SLC write speeds are only ~50MB/s faster, and native TLC writes show even less improvement. Interestingly, the drive is able to recover some performance more often throughout the write test, as indicated by the 6 performance peaks during the test, though if your workload is truly a sustained write, this isn’t likely to improve the overall experience much.
 This is actually a comparison that was already shown in my initial SSD roundup, but I’ll recap.
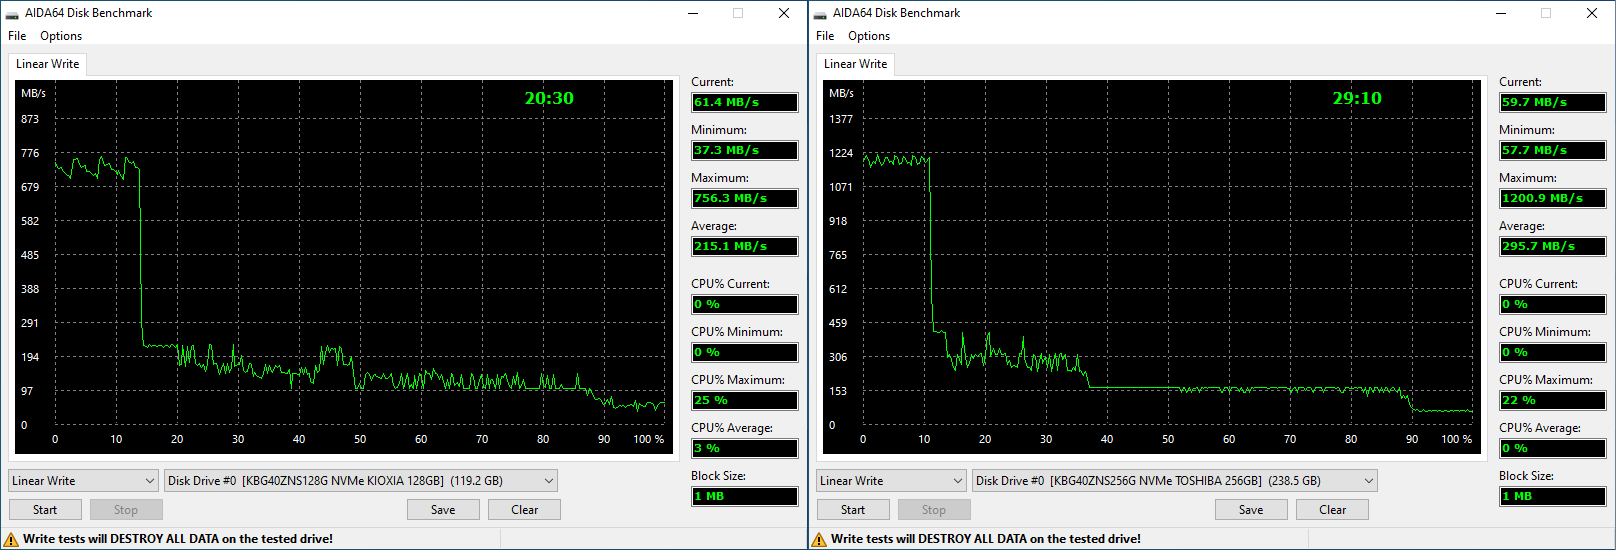
The 128GB model dedicates about 12% of its total capacity to SLC cache whereas the 256GB model dedicates closer to 10%. The 256GB model peaks at about 1200MB/s while the 128GB model only reaches about 750MB/s. After the SLC cache is exhausted, both drives fall considerably: the 255GB model to around 300MB/s and the 128GB to around 200MB/s. As the drives fill, performance continues to degrade on both models bottoming out well below 100MB/s on both capacities. Despite the strong start, this is pretty poor performance for the BG4 drives overall.
AS-SSD Sequential Tests
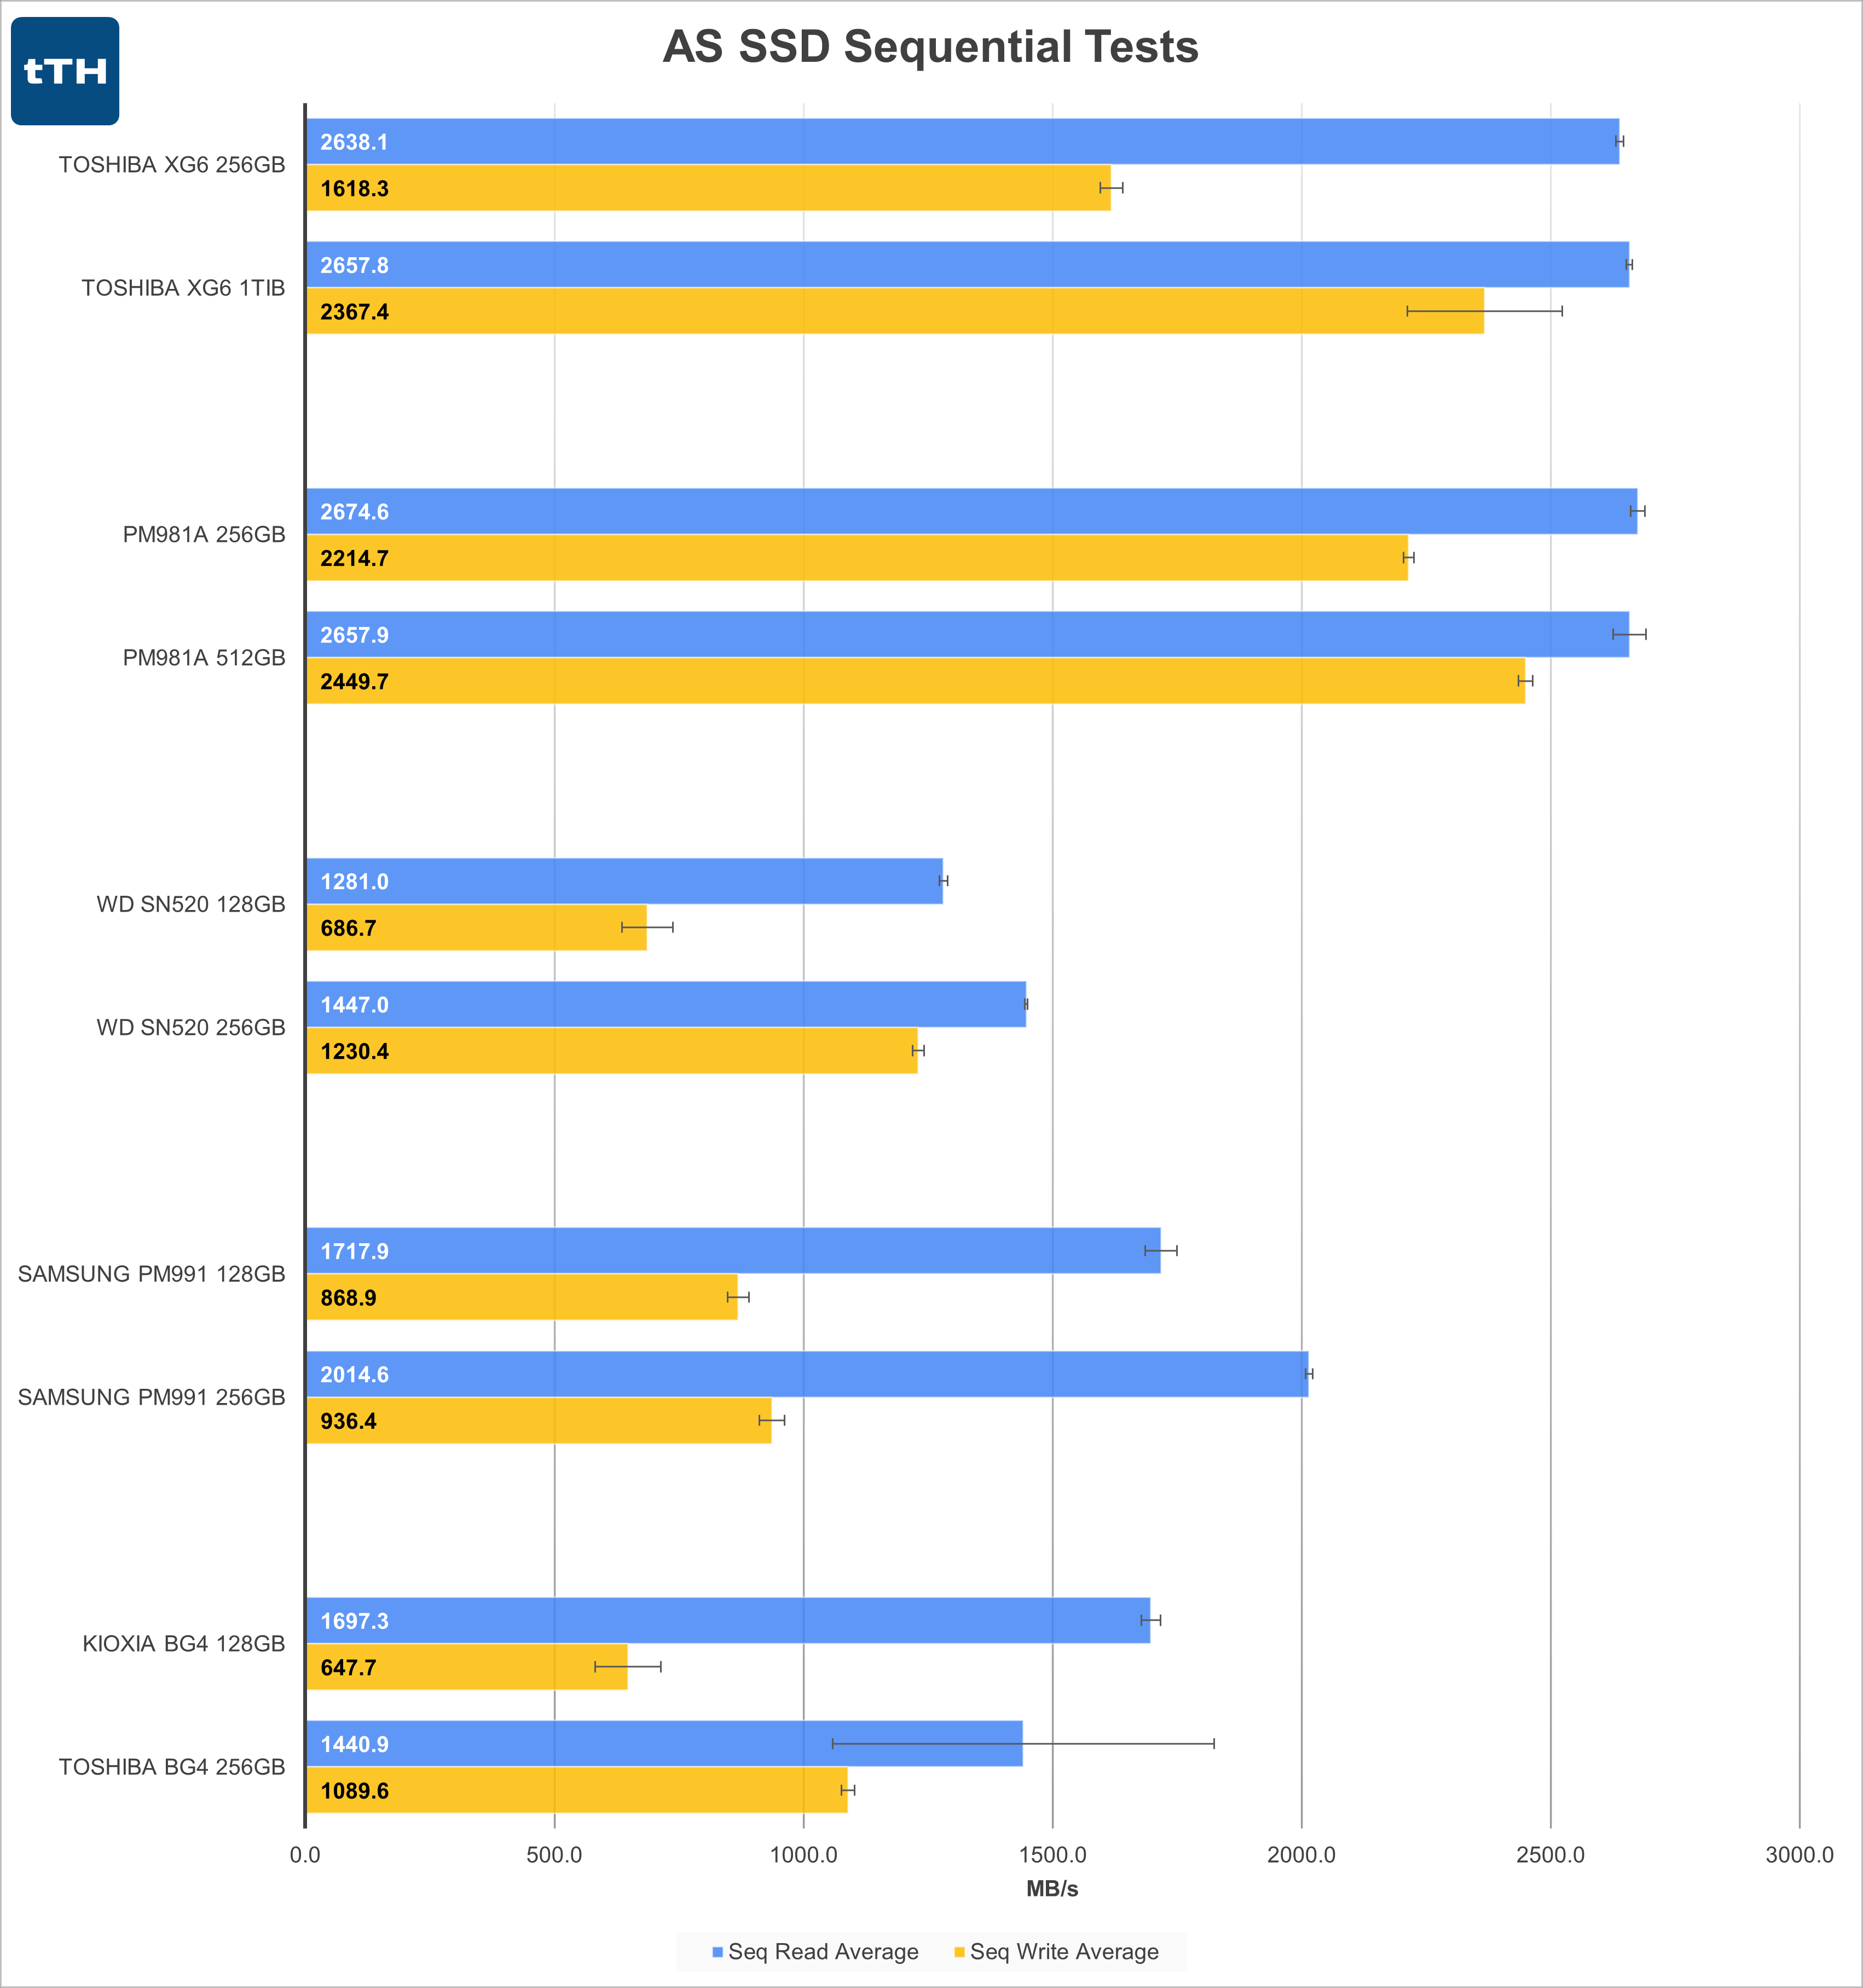 On the Toshiba XG6, the 1TiB model boosts write speeds by about 45% compared to the 256GB model, but read speeds remain largely unchanged due to bumping up against the peak reads speeds for high-end PCIe 3.0 controllers in this test.
The differences between the 256GB and 512GB Samsung PM981a are even smaller. Write speeds increase by around 10%, but read speeds plateau around the same 2600-2700MB/s range as the XG6.
Doubling NAND on the WD SN520 from 128GB to 256GB has an appreciable benefit, though performance ends up relatively low. Read speeds increase by about 13% and write speeds increase by a whopping 79%. This demonstrates how, especially for writes, this controller is being hampered by the decreased NAND parallelization on the 128GB drive.
For the Samsung PM991, read speeds increase by about 17% when doubling capacity from 128GB to 256GB, but write speeds increase a bit less than 8%. That’s not negligible, but it isn’t likely to be perceptible in day-to-day usage.
Finally, the BG4s. Write speeds increase by 68% on the larger drive. As for read speeds, this is where the data look a bit odd. The 256GB BG4 delivered data points for the read test with clusters of test results in the 1800MB/s and 1200MB/s range, hence the extraordinarily large error bar. As such, according to the average it appears that the BG4 regresses on read speed when increasing from 128GB to 256GB. Future retests will help determine if this is truly a characteristic of the drive or if it was just performing strangely the day I ran my tests.
AS-SSD 4K Tests
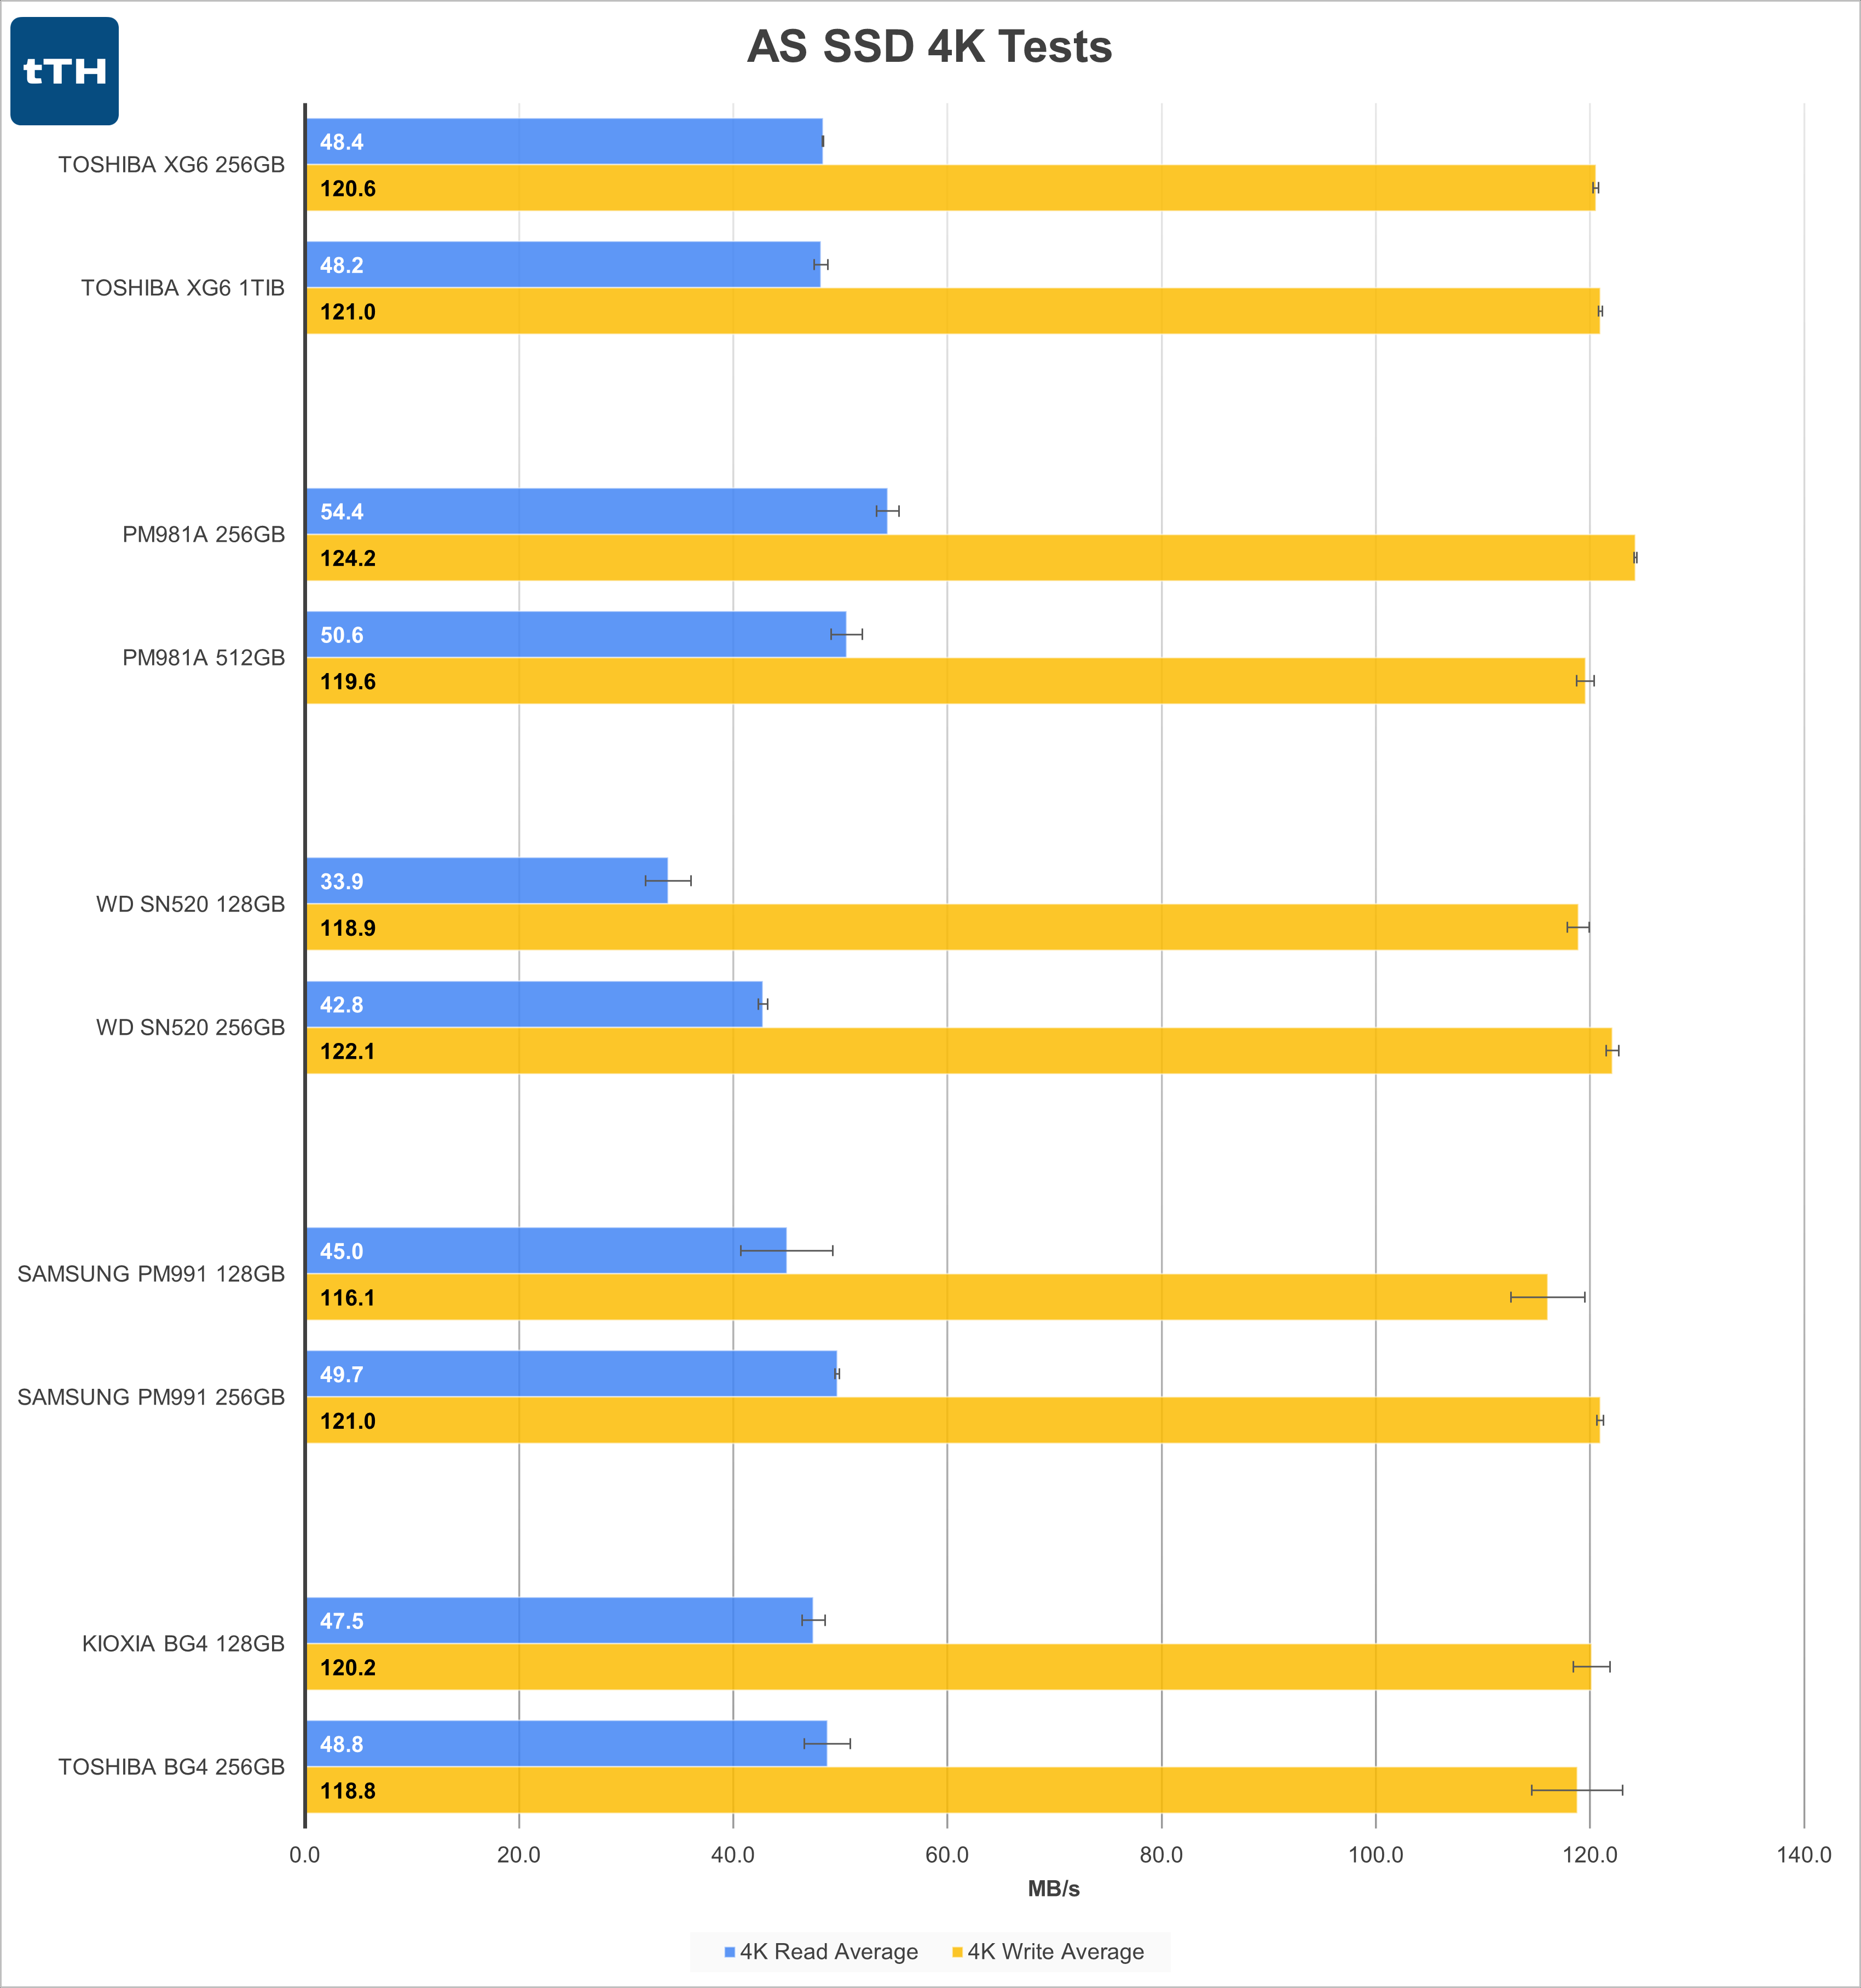 Unlike the Sequential tests, the 4K tests (1Q/1T) are largely unaffected by increases in NAND parallelization on these drives. Most of the larger drives are within a few percent of the performance of the smaller drives, except for the WD SN520 which gains an appreciable 26% in the 4K read test.
PCMark 8 Storage Test
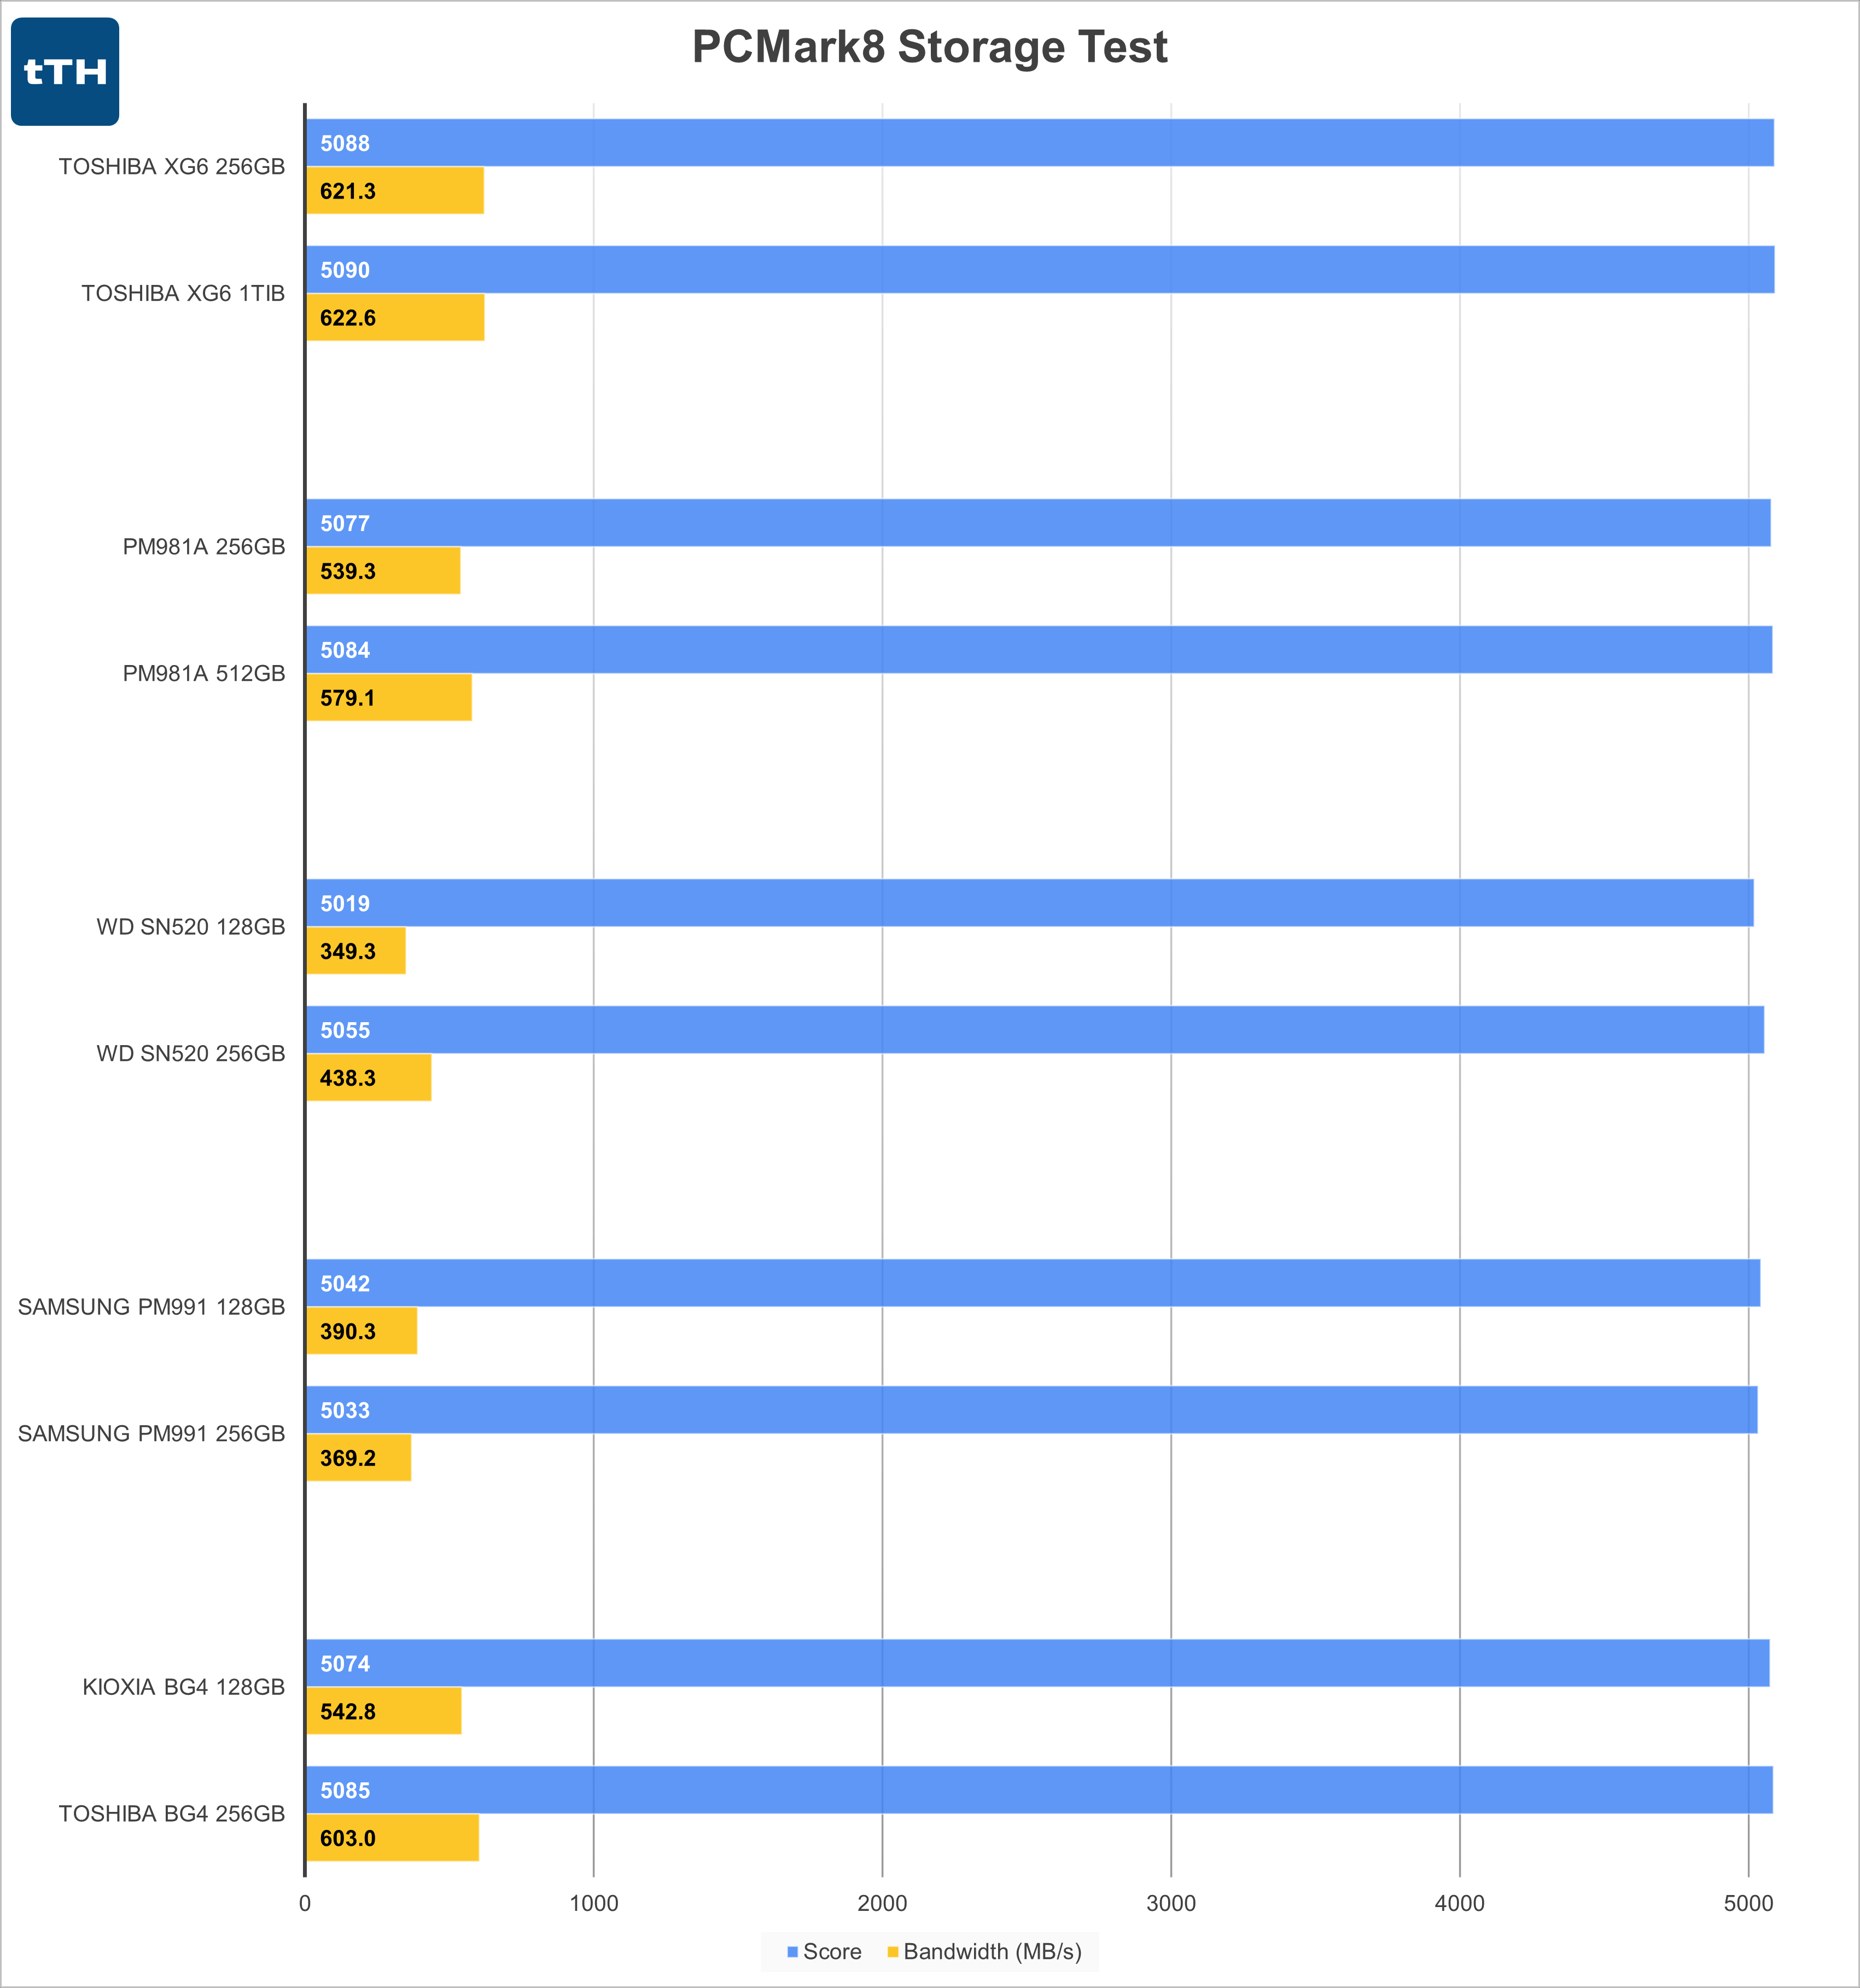 As the scoring in this tests isn’t sensitive to even large swings in SSD performance, the PCMark 8 Scores remain quite close between capacities of the same drive. The largest score increase is on the SN520 from 5019 to 5055 points, though due to the huge scale of these numbers this results in a less than 1% increase. The other drives show even smaller percentage variance due to capacity.
Since the Score metric is unenlightening at best, the number to look at here is the measured bandwidth. Here the larger XG6 delivers a mere 0.2% higher bandwidth, the larger PM981a produces 7% higher bandwidth, the 256GB SN520 achieves 25% greater bandwidth, the 256GB PM991 delivers a 5% regression, and the larger BG4 shows 11% higher performance.
The results within 10% likely won’t change user experience much, but the 25% gain by the SN520 stands out from the rest. Of course, in the context of overall performance, there are better drives than the 256GB SN520.
Large-File Transfer Tests
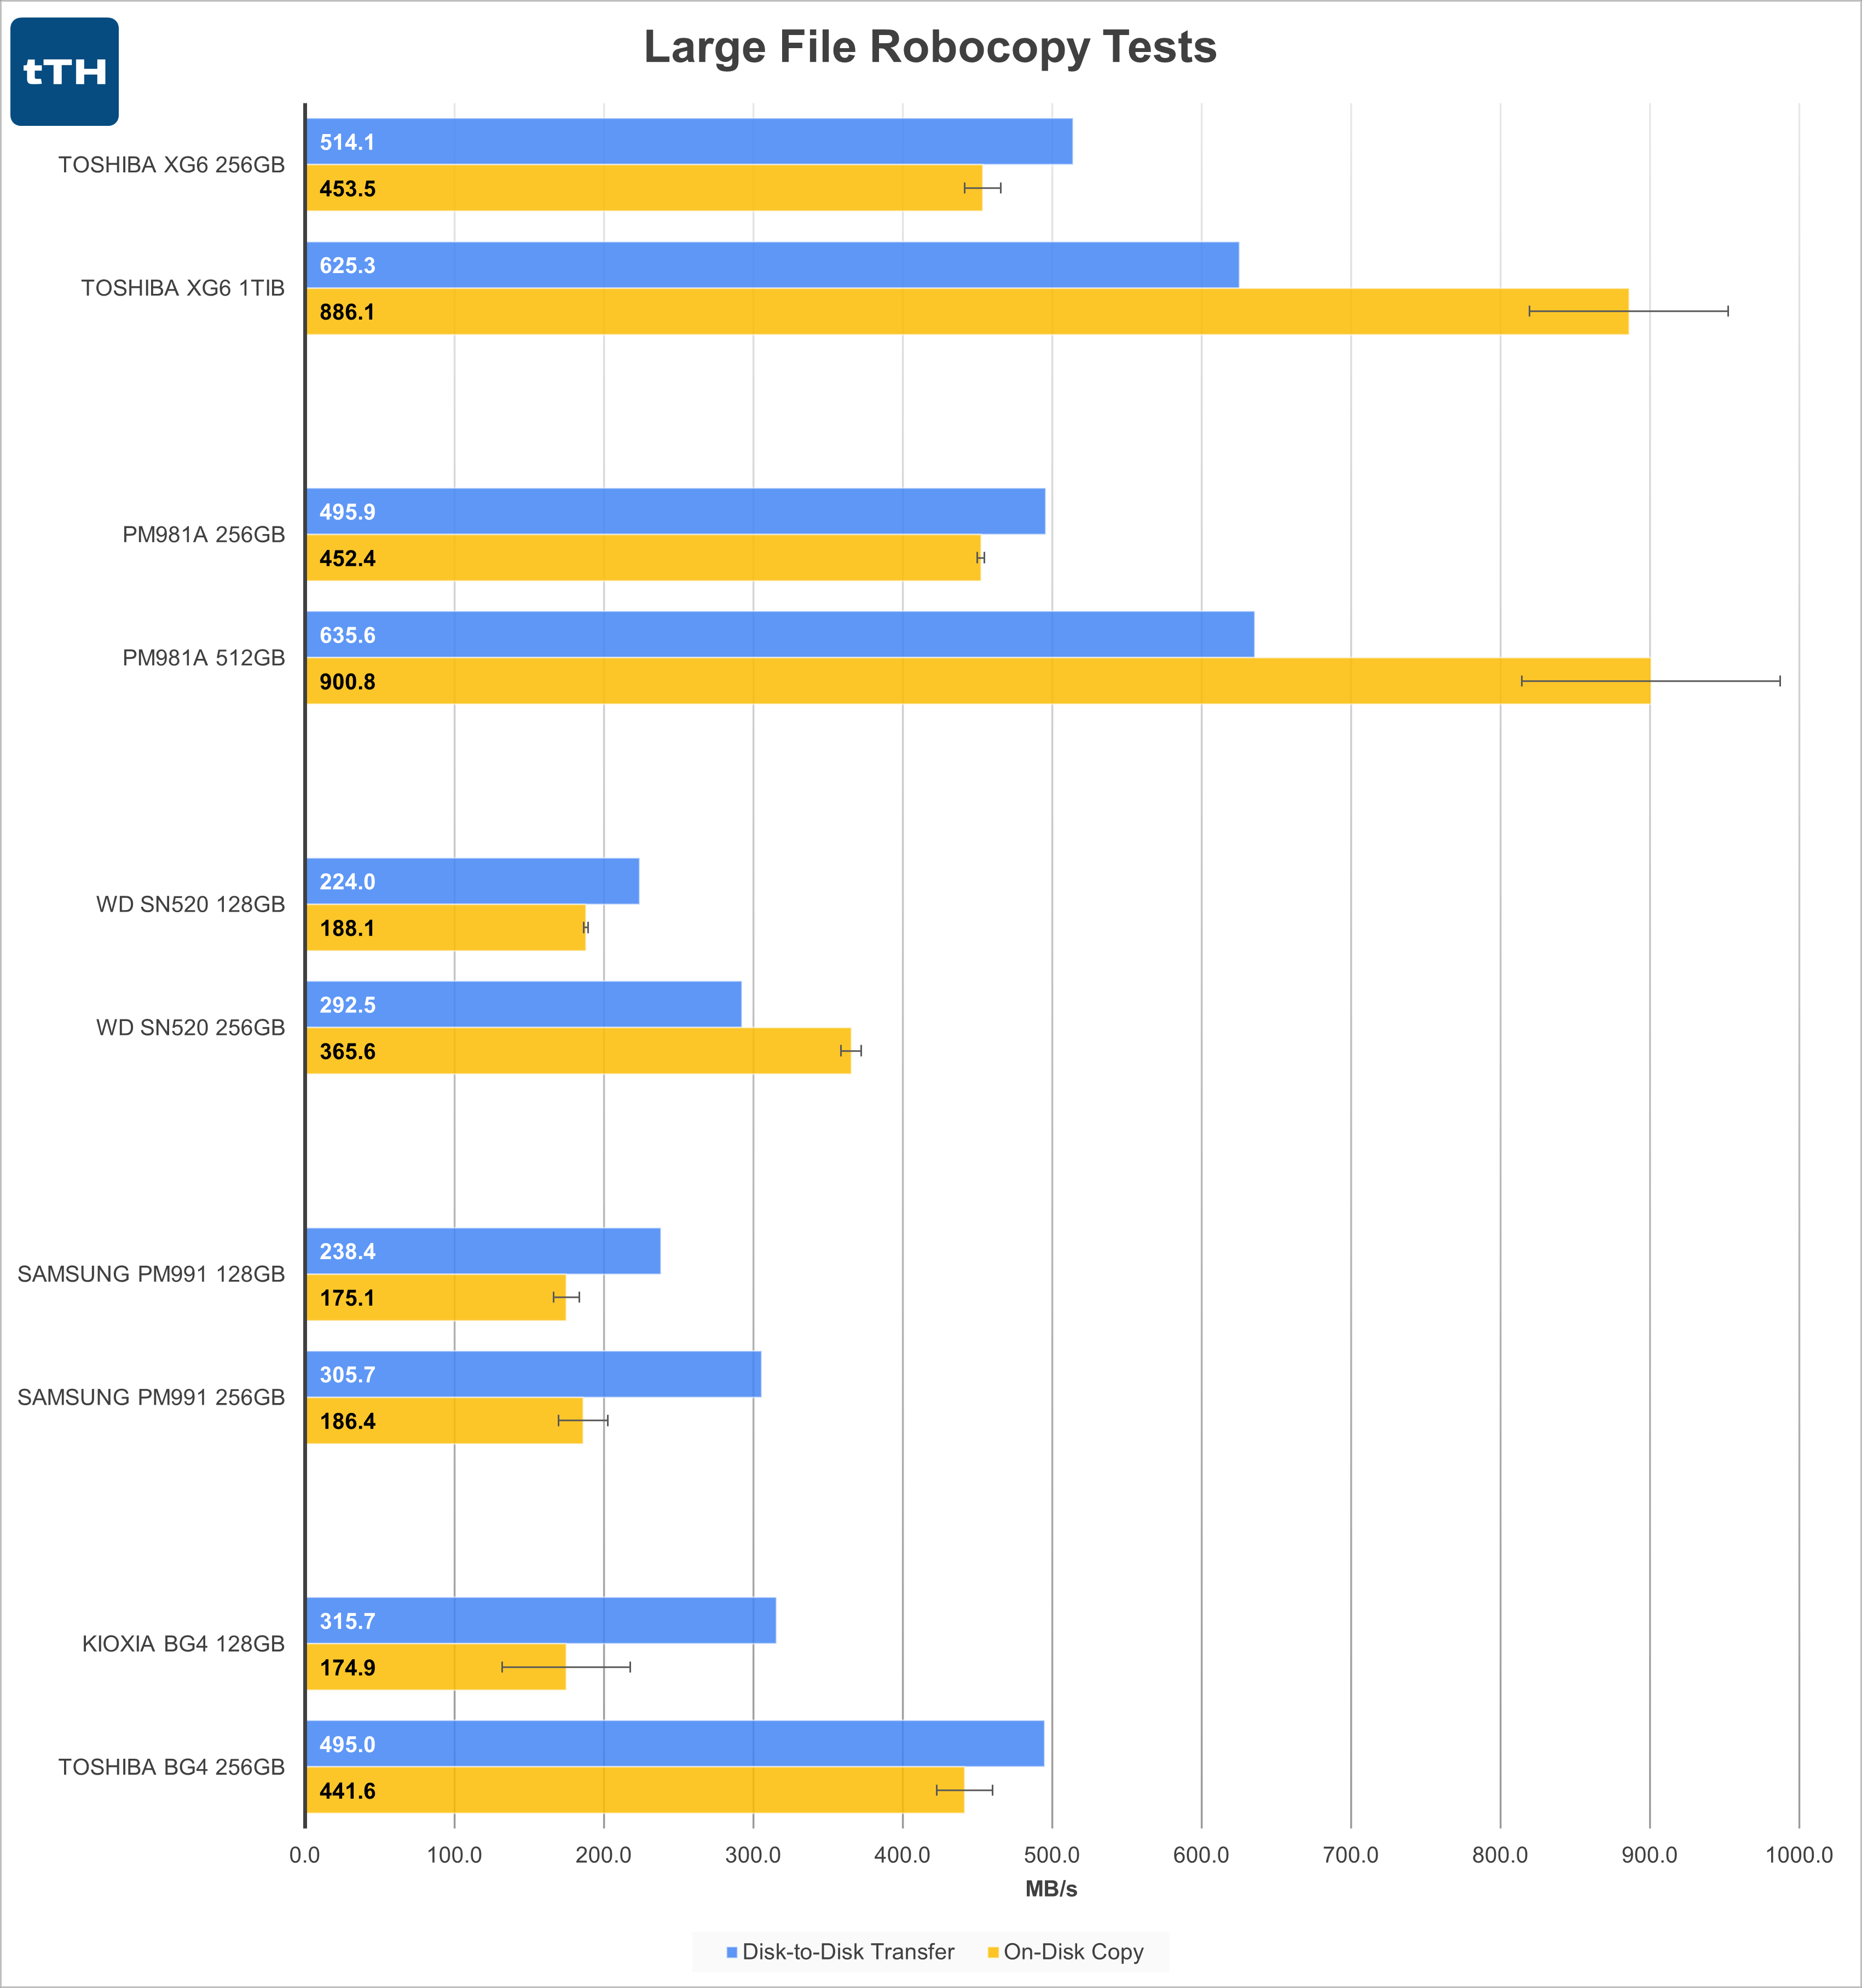 In case the disk-to-disk transfer, if numbers look a bit odd for the faster NVMe drives, recall that this test is a mostly sequential 30GB transfer from a read-source that peaks at 750MB/s. Unlike the 128GB drives that mostly don’t even peak at (let alone sustain) over 750MB/s, the faster drives are severely bottlenecked during the copy portion of this test as they can write at significantly greater than 750MB/s. This testing bottleneck will be remedied on my next-generation testbed.
The 1TiB Toshiba XG6 is bottlenecked on the disk-to-disk transfer whereas the 256GB model is not. Despite this limitation, the larger drive is nearly 22% faster than the smaller drive in this test, and the gap would be larger if reading from a faster drive. On-disk-copies for the 1TiB model are almost twice as fast as the smaller drive at 95% faster. This demonstrates decent scaling, though I’d really like to have the additional datapoint of a 512GB XG6 to see how much of the improvement happens between 256GB and 512GB, and between 512GB and 1024GB.
Like the larger XG6, the 512GB PM981a is also bottlenecked in the disk-to-disk transfer, yet still delivers 28% more performance. For on-disk copies. The larger PM991a is 99% faster than its smaller sibling demonstrating excellent, virtually linear scaling per capacity in this test.
The larger SN520 delivers around 31% more performance in the disk-to-disk transfer and 94% higher performance in the on-disk copy showing great scaling in the latter test.
The PM991 seems to gain the least from its capacity increase delivering only 28% higher transfer performance and 6% higher copy performance. This would indicate to me that the controller is lacking in areas other than NAND parallelization when it comes to these metrics.
For the BG4, doubling capacity from 128GB to 256GB yields 57% extra performance for the transfer test and 152% (2.52x!) the copy performance. The greater than linear scaling can likely be attributed to the difference in SLC caches between drives where the larger drive has more cache in addition to being faster at writing data both to the cache and directly to the TLC.
Small-File Transfer Tests
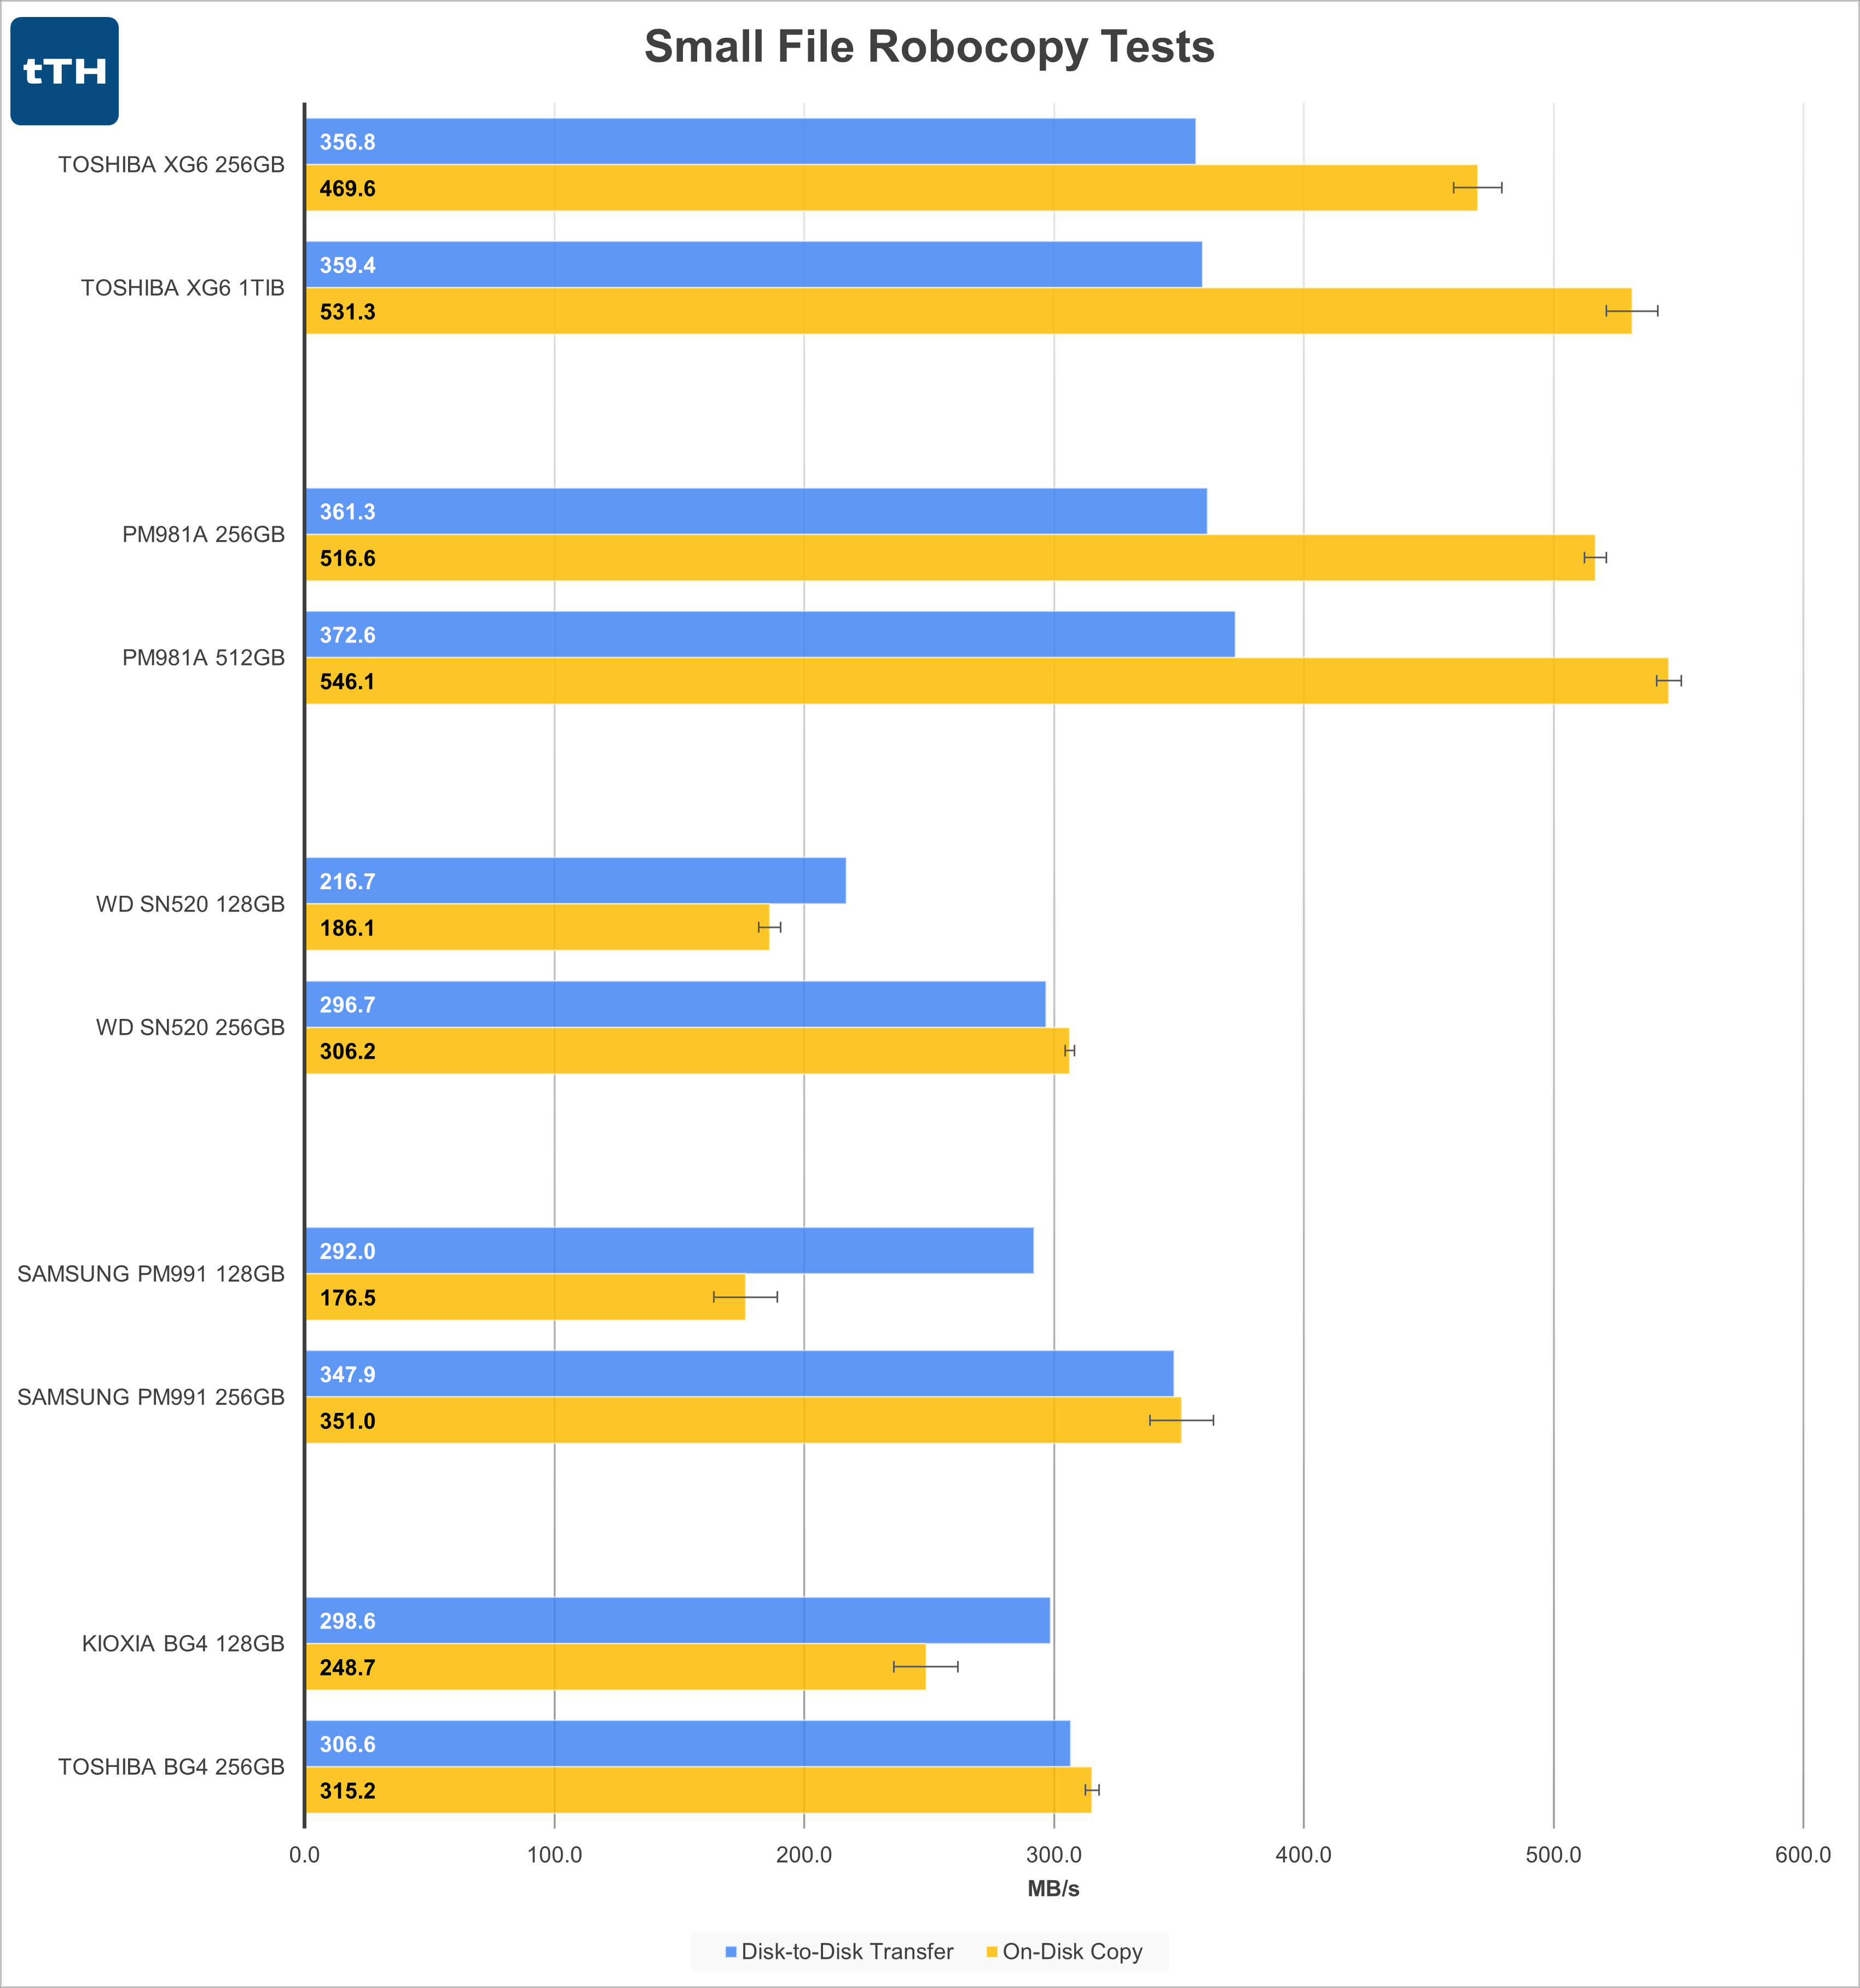 The small-file tests show less differentiation between the drives.
The XG6 and PM981a each run into a read bottleneck at both capacity points for the disk-to-disk transfer and show relatively small 13% and 6% performance increases in the on-disk copies for the XG6 and PM981a, respectively.
The 256GB SN520 shows a 37% improvement over the 128GB model in the transfer test and a 65% improvement in the copy test.
The Samsung PM991 delivers 19% more performance in the transfer test and 99% higher performance in the copy test when comparing the 256GB model to the 128GB. The near doubling of performance in the small-file copy test is an interesting reversal compared to the negligible increases seen in the large-file copy test.
The BG4 shows some of the smaller improvements in the small file tests with less than a 3% increase in transfer performance and 27% increase in copy performance when moving from 128GB to 256GB. This is another notable reversal in how performance scales, except that the BG4 scales poorly in the small-file test and scales well in the large-file test.
The results for the SN520, PM991, and BG4 are all a bit odd in that the 256GB models’ on-disk performance exceeds the disk-to-disk transfer rate, despite the transfer performance falling well behind the bottleneck illustrated on the XG6 and PM981a. This is also despite the fact that the disks are busier during the copy test when compared to the transfer test. Though academically interesting, I don’t think this really means much. Assuming that these drives continue to scale with capacity, I’d expect the copy performance of larger capacities to continue to extend their lead over the transfer speeds.
Conclusion
By looking at an assortment of this many drives at different capacities, there’s a lot of data to unpack. First of all, it is apparent that the drives don’t all scale similarly and that the drives scale differently from test to test. It also seems relatively apparent that 4K performance and thus (unsurprisingly) application performance is mostly unaffected by larger capacity drives. On the other hand, sequential reads and writes as well as disk copy performance can be greatly impacted by drive capacity.
A key takeaway I was trying to illustrate in this review is that buying a high-end drive doesn’t always get you the best performance. Especially if you’re budget constrained and have to skimp on capacity, you might theoretically get better performance from a larger lower capacity drive rather than a smaller high-end drive, though in this review I don’t have any specific data points to reference that make this case. The 1TB XG6 outperforms a 256GB PM981a, but in most cases is many times more expensive as well.
Also illustrated in the review is that larger drives won’t always perform better. In several tests, the lower end drives showed meager improvements at larger capacities. Additionally, even if some inferences need to be made, I would confidently surmise that a 512GB BG4 would be outperformed by either a 256GB XG6 or PM981a due to the drives simply belonging in different performance and price classes.
Overall, I’d say the important finding is that SSDs, like many types of computer hardware, are complex and you can’t judge them by any single metric. This shouldn’t come as a shock to anyone already well versed in computer technology, but just goes to show that the adage applies to SSDs as well.