Compact M.2 SSD Roundup — Short But Sweet?
I run seven low-capacity, physically diminutive M.2 SSDs through a series of tests to determine how well they might perform as either a boot drive or for performing large-file transfers.
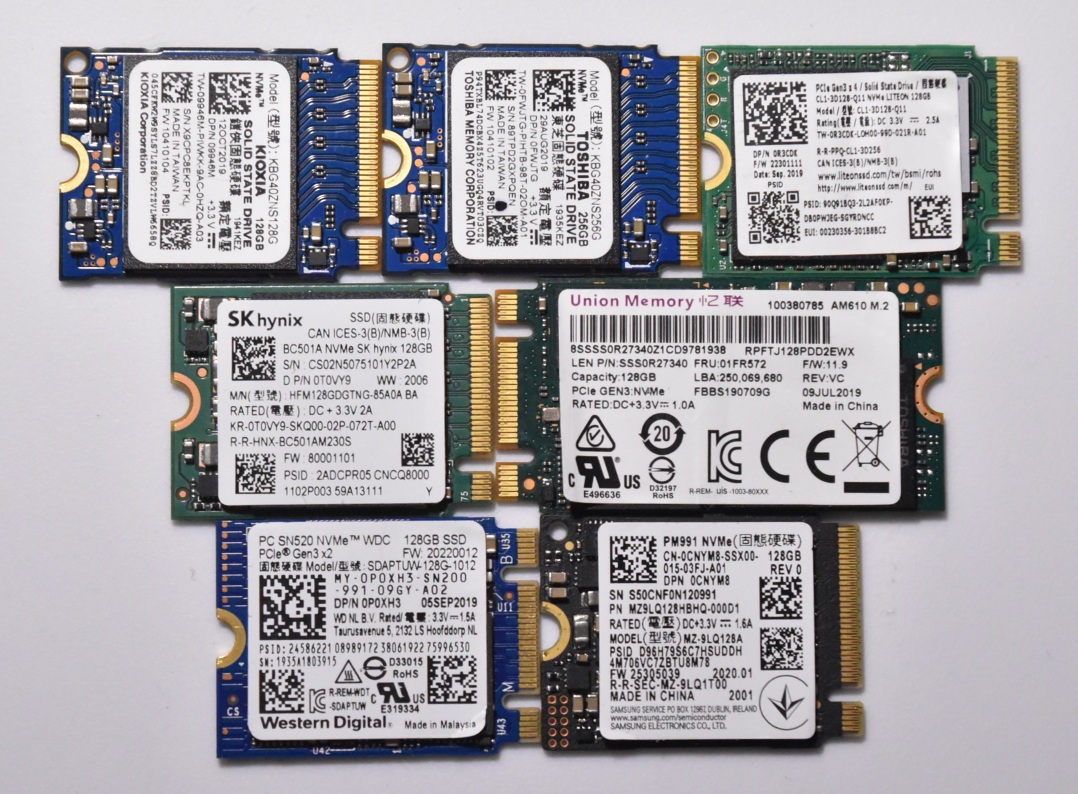
In this roundup I test the following seven drives (in no particular order):
- Kioxia BG4 128GB
- Toshiba BG4 256GB
- Lite-On CL1 128GB
- SK Hynix BC501A 128GB
- Union AM610 128GB
- WD SN520 128GB
- Samsung PM991 128GB
If you’re restricted to a 2242 or smaller M.2 drive on a budget, I’d recommend either the BG4 or the PM991 as a boot drive and either the SN520 or PM991 for use in an external enclosure for large file transfers. That said, particularly for the latter use case, you might be significantly better served by going with a higher capacity drive or even a SATA drive. Read on to see how I get here!
Before I begin, if you want to know more about how I intend to perform my tests, check out my first blog post: SSD Review Background, Setup, and Methodology v1.0.
The premise of performing this set of benchmarks is that I’m building up a system on an older ITX motherboard — an Asrock Z97E-ITX/ac. I have a whole beleaguered story surrounding this board that I intend to write up separately. Regardless, I just needed a low capacity 128-256GB PCIe M.2 boot drive to throw an OS onto as the machine is intended to replace an existing NAS of sorts and won’t have many applications on the boot drive.
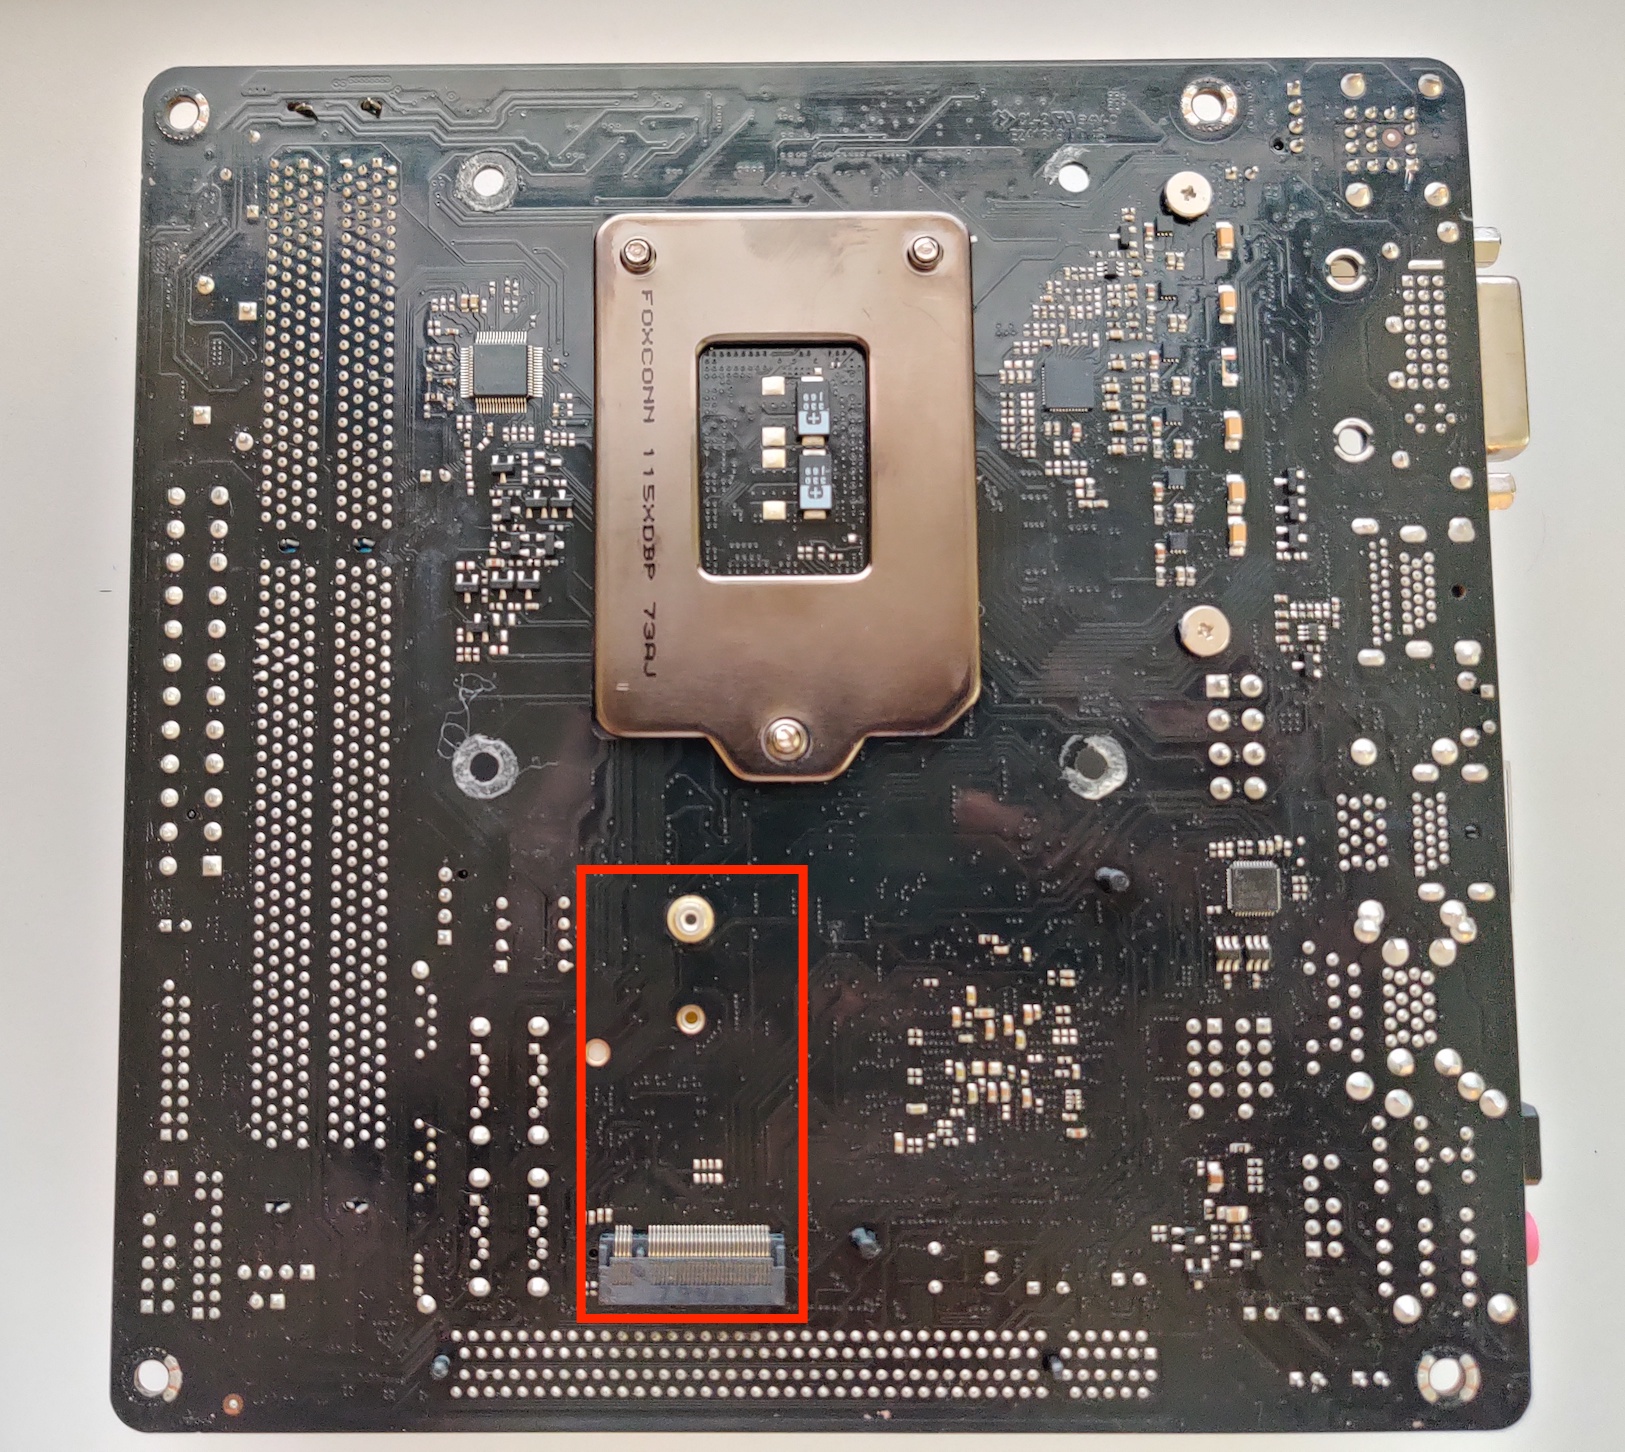
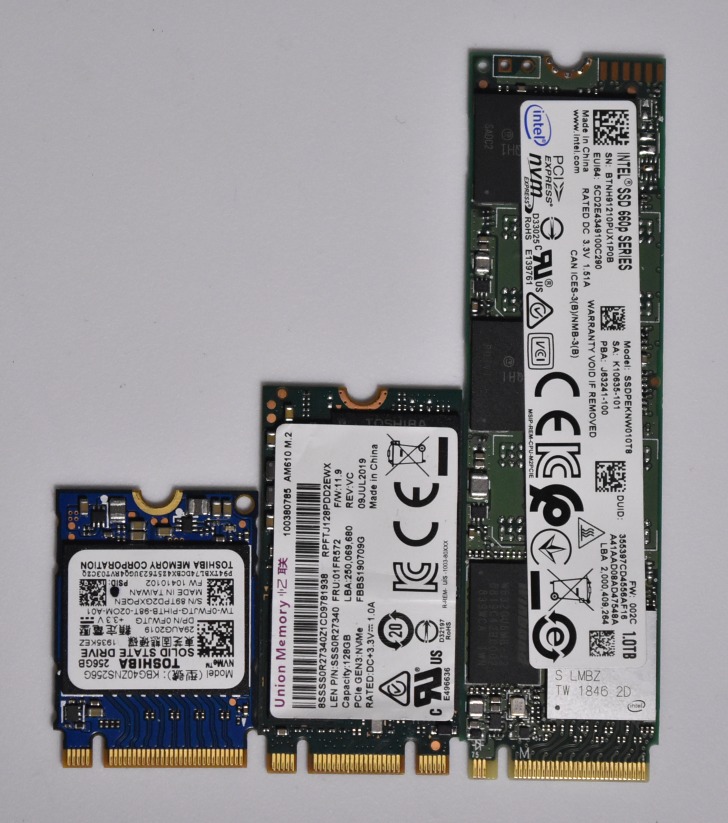
Though a PCIe SSD theoretically offers greater performance than a more traditional 2.5” SATA drive, in this situation I’m eschewing SATA to free up ports on the motherboard for more spinning 3.5” drives, not for the performance characteristics of PCIe. This board has an M.2 slot on the back, but it only accepts shorter 2230 or 2242 form factor drives, not the more common 2280 drives (there are also 22110 drives, though these are relatively uncommon). For M.2 the first two digits signify the width of the drive and the remaining digits signify the length — both in millimeters.
The design of short M.2 drives is an exercise in minimalism. With little PCB real estate available, you can only fit so many components onto a drive. Early 2.5” SATA SSDs had PCBs that took up the whole drive footprint, and often had a controller, (a DRAM chip to cache the Flash Translation Layer), and a number of NAND Flash packages (chips) on both sides of the board. Due to the capacity and density limitations of early NAND flash memory, these older drives could have as many as 16 flash packages onboard to reach what are today rather pedestrian capacities. These diminutive drives are limited to a single NAND package.
In the scheme of things, drive performance wouldn’t matter very much in my intended application — mostly because the M.2 slot on this Z97 motherboard is connected to the chipset rather than directly to the CPU and is only PCIe 2.0 x2. Therefore, peak performance would be capped to a bit less than the theoretical peak 1GB/s offered by a PCIe 2.0 x2 (by two) configuration. Still, some SSDs, particularly DRAMless models, could perform significantly worse than even SATA drives.
From reading Anandtech articles, I knew that there was a Toshiba (now Kioxia) BG4 and a Western Digital (WD) SN520. A quick search on the internet-at-large as well as on eBay turned up a few more models in the 2230 or 2242 form factor, but I couldn’t find any benchmarks for most of the drives, and even the thorough Anandtech coverage was of the 1TB model which wouldn’t be very representative of performance of the 128GB or 256GB drives.
Thankfully, the 128GB drives were all pretty inexpensive (ballpark of $20) as they’re mostly OEM drives pulled from laptops, so I pretty quickly decided to just buy each drive and benchmark them all. Of course eBay being eBay, the SN520 I ordered showed up and was actually a BC501A, so I had to order a 2nd SN520 and ended up with 2x BC501As.
Though the impetus of writing this initial review is to find a suitable boot drive, a secondary use case I’m testing for is suitability of the drives in an external enclosure for transferring large amounts of data — since I’m going to have a few spare drives after this. For this secondary use case sustained write performance will be key.
The Drives - By The Numbers:
| The Drives - Table of Specifications | |||||||
|---|---|---|---|---|---|---|---|
| Kioxia BG4 | Toshiba BG4 | Lite-On CL1 | SK Hynix BC501A | Union AM610 | Western Digital SN520 | Samsung PM991 | |
| M.2 Dimensions | 2230 | 2230 | 2230 | 2230 | 2242 | 2230 | 2230 |
| Capacity | 128GB | 256GB | 128GB | 128GB | 128GB | 128GB | 128GB |
| Interface | PCIe 3.0 x4 | PCIe 3.0 x4 | PCIe 3.0 x4 | PCIe 3.0 x4 | PCIe 3.0 x2 | PCIe 3.0 x2 | PCIe 3.0 x4 |
| NVMe Protocol | 1.3 | 1.3 | 1.3 | 1.2 | 1.2 | 1.3 | 1.3 |
| Seq Read | 2000 MB/s | 2200 MB/s | 2000 MB/s | 1500 MB/s | 1500 MB/s | 1500 MB/s | 2000 MB/s |
| Seq Write | 800 MB/s | 1400 MB/s | 1100 MB/s | 395 MB/s | 490 MB/s | 800 MB/s | 1000 MB/s |
| I/O Read | 200K | 330K | ? | 60K | 60K | 95K | 64K |
| I/O Write | 150K | 190K | ? | 50K | 50K | 90K | 220K |
| Active Power | 3.4W | 3.6W | ? | 2.5W Active Read | ? | 1.2A Peak Power | ? |
| Idle Power | 5mW | 5mW | 5mW L1.2 | 2.5mW Sleep (PS4) | |||
| Components | 1 BGA Package | 1 BGA Package | Controller & NAND | 1 BGA Package | Controller, DRAM & NAND | Controller & NAND | 1 BGA Package |
| Controller | Toshiba | Toshiba | SMI 2263XT | SK Hynix In-house? | Phison E8 | SanDisk 20-82-00703-A1 | Samsung |
| NAND | Toshiba 96-layer BiCS4 TLC | Toshiba 96-layer BiCS4 TLC | Toshiba 96-layer BiCS4 TLC | Presumably SK Hynix 3D TLC | Toshiba 3D TLC | SanDisk 64-layer TLC | Samsung 3D TLC |
| Rated Endurance | 100TBW | ||||||
| Retail/OEM Drive | OEM | OEM | OEM | OEM | OEM | OEM | OEM |
| Price Paid (USD) | $23.90 | $36.99 | $21.99 | $25.99 | $20.99 | $23.95 | $21.99 |
Since these are all OEM drives, official specifications are hard to come by. Admittedly, none of these are particularly exciting looking drive drives, but that doesn’t mean that there won’t be any surprises. I expect that the differences between the drives could actually be quite interesting! Notably, all the drives are 2230 — except the Union AM610 which is 2242. All drives utilize the PCIe 3.0 specification. The Union and WD drive are x2, and the rest are all x4. The PCIe generation and number of lanes won’t end up mattering in my final NAS build since the drive I pick will be limited to 2.0 x2 anyway. But for these benchmarks I’ll be utilizing a testbed that can fully harness 3.0 x4.
Going into the tests I was moderately interested to see whether there’s a strong correlation between performance and PCIe bandwidth since none of these drives, particularly in these smaller capacities, has very high specs, even on paper.
Also notable is that there was a good variety of drive configurations:
- Discrete controller, NAND, and DRAM
- Discrete DRAMless controller and NAND
- Single BGA package with the controller, NAND, and any potential DRAM/SRAM cache all in one
All the drives in this roundup appear to use what is now the de-facto mainstream “standard” TLC rather than the faster MLC or slower QLC. Many articles have already been dedicated to the different types of flash, so for now I’ll just link to a relatively old (but still quite valid) article on Anandtech: Understanding TLC NAND which covers some good basics and explains how NAND flash has evolved from SLC to MLC to TLC.
The linked article doesn’t cover QLC, but the same general trends apply to QLC as happened in the SLC -> MLC -> TLC evolution, namely higher storage density at the cost of lower endurance and higher latency (lower speed). Newer controllers have counteracted some of the negative effects with better error correction.
Additionally, the advent of 3D NAND has enabled more storage capacity per chip by allowing memory to be manufactured with many layers instead of just a single planar layer of cells. This allows vastly larger capacities in the same footprint, or the same capacity in a reduced footprint.
The Drives - One by One (still in no particular order):
Kioxia BG4 128GB
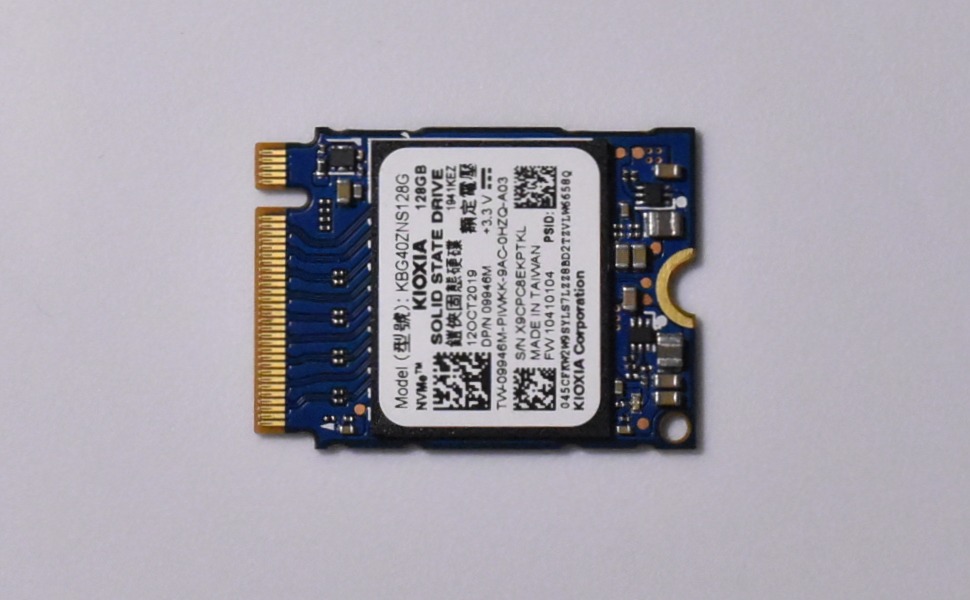 Having recently rebranded their flash division from “Toshiba” to “Kioxia”, the BG4 is a model that existed both before and after the branding transition. Newer drives appear with the Kioxia branding, whereas older drives have Toshiba branding. The specifications between them are the same. The BG4 128GB is a single component solution combining NAND and Controller onto a single BGA package. The NAND is of the 96-layer Kioxia BiCS4 variety. The drive is DRAMless and connects to the host system via a PCIe 3.0 x4 connection. Of the drives in this roundup, the BG4 seems to have the most pre-existing online coverage, but most of that is for larger capacities that are sure to deliver more performance than this 128GB example.
Toshiba BG4 256GB
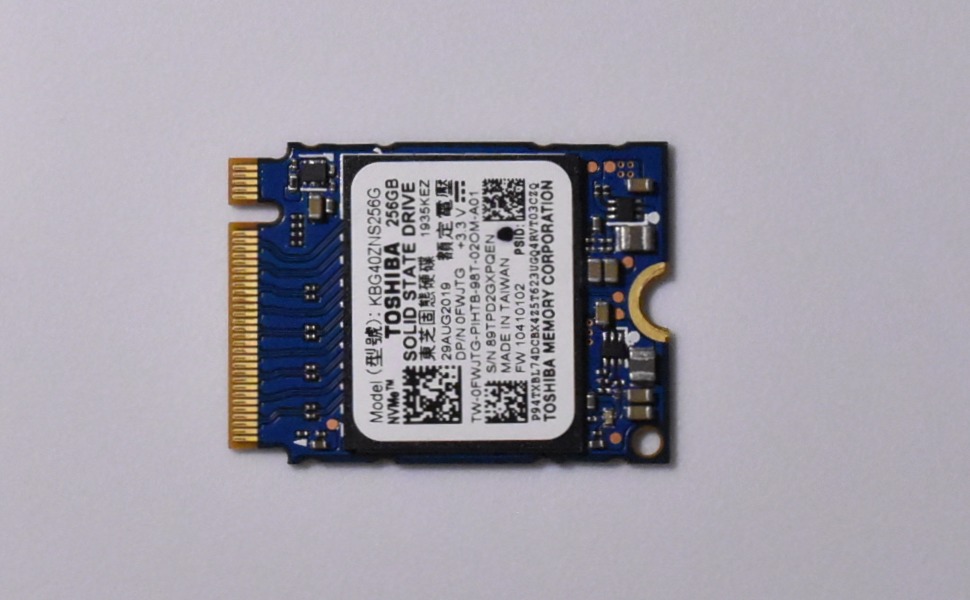 My 256GB BG4 example was still branded “Toshiba”. Notably, it needed a firmware update to bring it up to the same firmware as my newer 128GB sample, but a bit of internet searching uncovered an upgrade file from an appropriate OEM.
Like the 128GB model, this is an all-in-one BGA package, just with twice the flash and likely twice the number of NAND dies — which should lead to better performance in most use cases due to the integrated controller being able to perform more operations in parallel. I’m mostly including this larger drive to illustrate how larger drives can deliver greater performance (to a point). If I’m able, I’ll see about sourcing 512GB and 1TB BG4 models to show scaling and how adding more flash can have diminishing returns.
Lite-On CL1 128GB
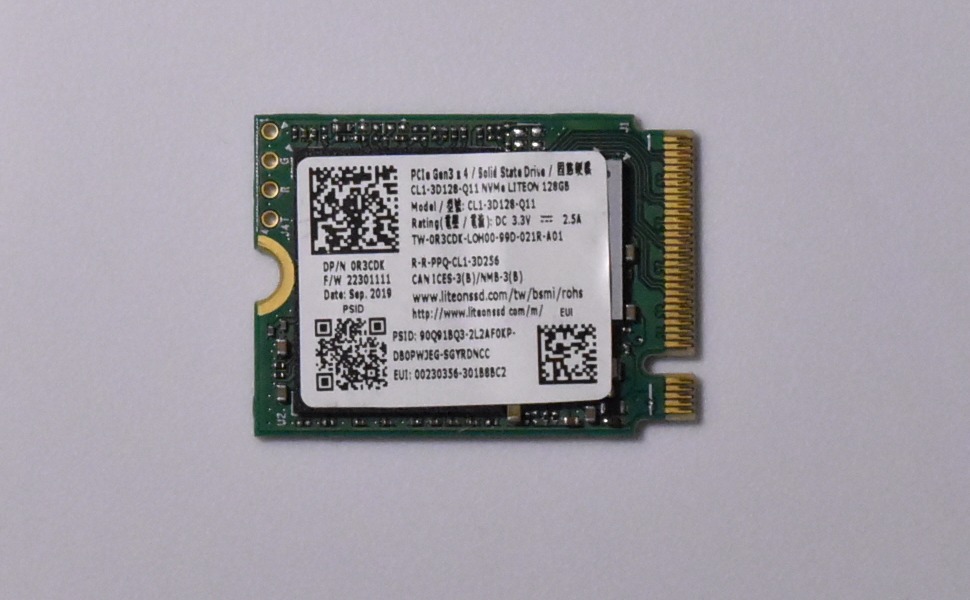 I wasn’t sure what to expect of the CL1. The drive uses the familiar SMI 2263XT DRAMless controller with Toshiba 96L TLC NAND. When populated with more NAND packages, the controller has been previously demonstrated to deliver decent performance. Not class-leading by any metric, but at least not horrendous considering its DRAMless nature.
The spec sheet was relatively useless as Lite-On doesn’t list separate specs for the various capacities of the CL1, and the 2230 drive has capacities reaching 512GB. Lite-On also sells the CL1 in the 2242 form factor, which just adds some bare PCB to the end of the drive and a 2280 version that can fit two NAND packages allowing capacities up to 1TB. If you’re purchasing this drive and need it to be a specific length, check the seller’s listing carefully to make sure you’re picking the right drive.
I wasn’t sure what to expect of the CL1. The drive uses the familiar SMI 2263XT DRAMless controller with Toshiba 96L TLC NAND. When populated with more NAND packages, the controller has been previously demonstrated to deliver decent performance. Not class-leading by any metric, but at least not horrendous considering its DRAMless nature.
The spec sheet was relatively useless as Lite-On doesn’t list separate specs for the various capacities of the CL1, and the 2230 drive has capacities reaching 512GB. Lite-On also sells the CL1 in the 2242 form factor, which just adds some bare PCB to the end of the drive and a 2280 version that can fit two NAND packages allowing capacities up to 1TB. If you’re purchasing this drive and need it to be a specific length, check the seller’s listing carefully to make sure you’re picking the right drive.
SK Hynix BC501A 128GB
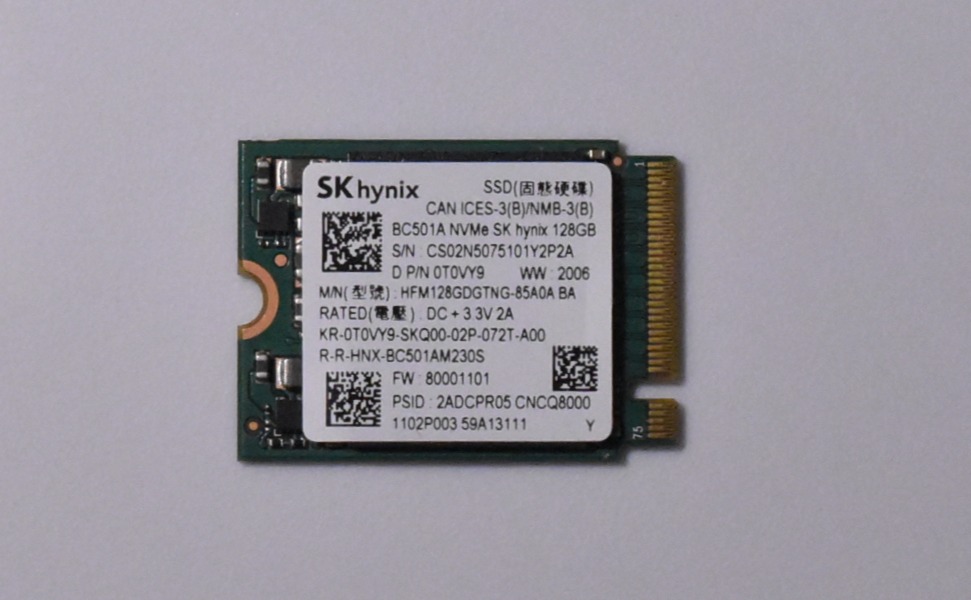 Having read the SK Hynix P31 reviews shortly before diving into this review, I had relatively high hopes for the BC501A. That said, there’s paltry little information about the SSD other than my physical observation that it is a single BGA package.
Despite being a PCIe 3.0 x4 drive, it has the lowest sequential write speed rating and is tied for last place in sequential read performance with the PCIe 3.0 x2 drives — at least on paper. But as anyone who has been following the SSD market can tell you, the spec sheet doesn’t necessarily translate into real-world performance, so I still had some expectation that it might not fall to last-in-pack performance. We’ll see.
Union AM610 128GB
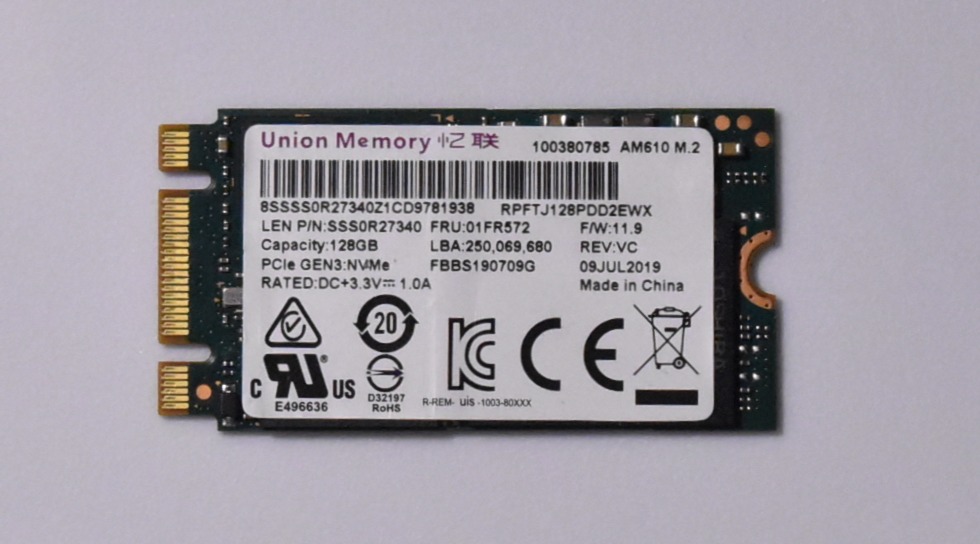 Based on what I’ve been able to find across the internet, Union is a partnership between Lenovo and Ramaxel to deliver inexpensive SSDs for prebuilt OEM PCs. The first of two PCIe 3.0 x2 drives, the AM610 is immediately capped to performance lower than the theoretical maximum of 1970MB/s of that PCIe configuration. By peeling back the sticker on my unit, I was able to determine that this drive uses a Phison E8 controller paired with Toshiba branded NAND.
I was surprised to find that the controller had a DRAM cache (the chip labeled “Nanya”). As the only drive in this lineup that uses the slightly larger 2242 form factor, this concession of a slightly larger PCB was probably required to fit all three packages. The DRAM cache could theoretically provide a significant advantage in some workloads, but whether it delivers remains to be seen.
As this is the first Union drive I’d ever owned, I wasn’t really sure what to expect. The PCIe bus limitations could impose a peak performance limit, but at least so far, even the top performing drives in this roundup barely need more than two PCIe 3.0 lanes to extract the full performance promised on their spec sheets.
Western Digital SN520 128GB
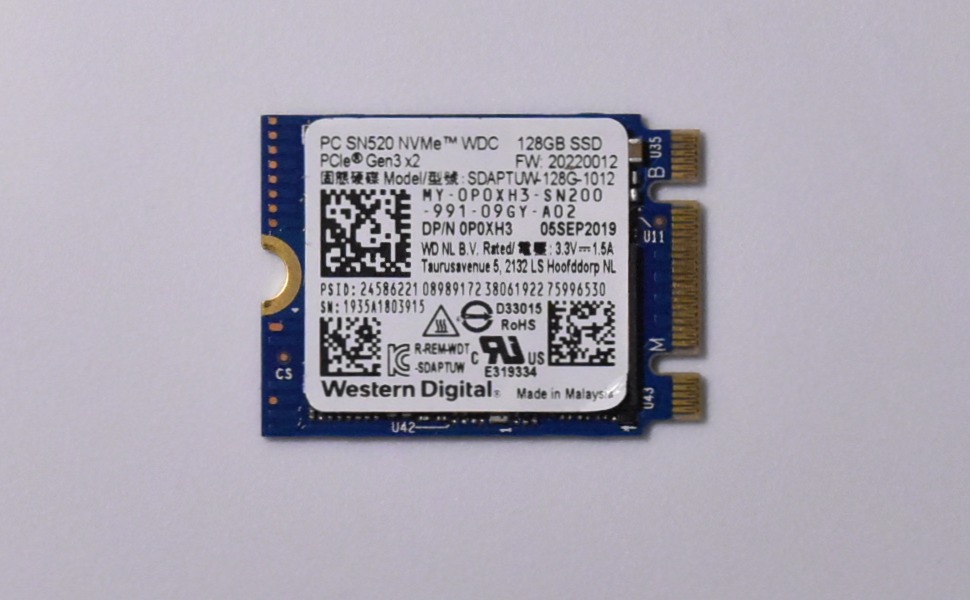 The Western Digital SN520: the drive that got this whole process started. I’d read an SSD review on a major tech site where they mentioned the SN520, which got me curious about its performance.
The drive utilizes a discrete SanDisk controller and Toshiba NAND package. The controller, an unoriginally named SanDisk 20-82-00703-A1 (you can see where I peeled up the sticker to get a look at the controller), appears to be the same one used by the retail WD SN500. The SN520’s on-paper specs are a bit higher than the AM610 — the other PCIe 3.0 x2 drive in this roundup — but that doesn’t necessarily carry a lot of weight.
Interestingly, this is the only drive I was able to find an endurance specification for. For what it is worth, the 128GB model is rated for 100TBW.
Samsung PM991 128GB
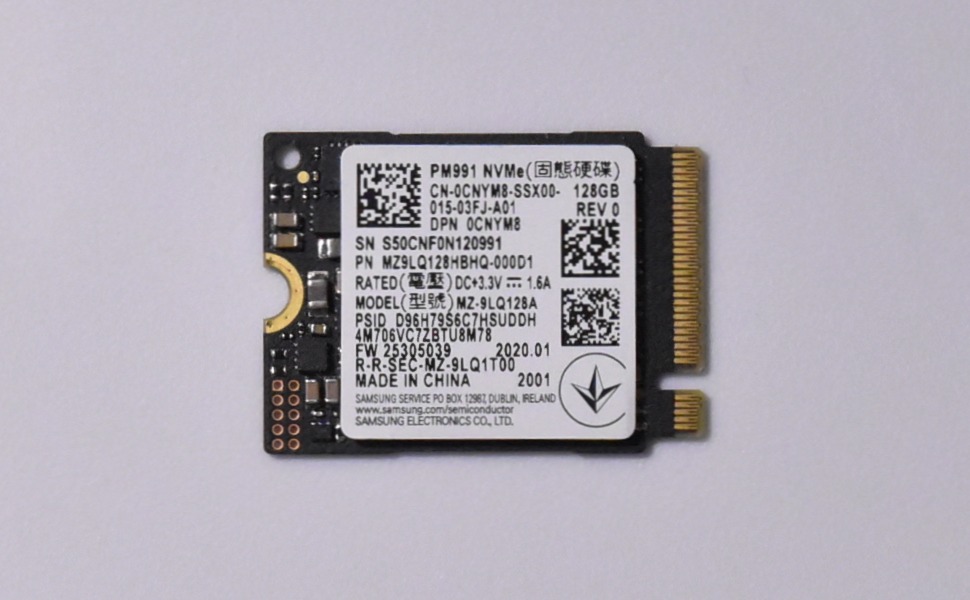 Last but not least, the PM991. Samsung has definitely earned a reputation for performance SSDs over the years with generally class-leading performance in their 850 and 860 series SATA SSDs and essentially all of their retail PCIe SSDs, including the 960, 970, and (now) 980 series.
In many cases, the OEM drives are simply non-branded versions of their retail counterparts. But, as seems to be the trend for these budget OEM drives, the PM991 is a single BGA package. I’m not aware of Samsung selling a PCIe drive at retail with that configuration, but the spec sheet advertises top-tier performance for this group. Still, performance could be basically anywhere. At least this isn’t a QLC-flash-based drive.
Review
Before we get into the results, if you’d like to know more about my hardware setup as well as my testing methodology, check out my SSD Review Background, Setup, and Methodology v1.0 piece.
As mentioned elsewhere, I tried to glean two pieces of information: which drive (or drives) are best as a boot drive and which drive (or drives) are best for use in an external enclosure for transferring large files.
I performed all the tests in the review before beginning to compile the data, so for some tests, some drives delivered inconsistent performance from run to run. I didn’t realize this until more than a month after I’d finished collecting the data, but at this point I figured it would be more beneficial to the community at large (all seven of you reading this) to get the data out rather than spend even more time going back and retesting things.
As I put together new content, I’ll keep an eye out for inconsistent performance and take steps to make sure my methodology is consistent. If drives still deliver erratic performance, then it is likely that the drives actually behave erratically. For now, take note of the error bars (+/- one standard deviation) on the tests that have multiple runs.
Since all but one of the drives are 128GB, my commentary is going to focus on those. The lone 256GB drive — a BG4 — is mostly present for reference and to serve as an example of what higher capacity drives might look like compared to the smaller example drives I included. In the future I hope to get 256GB versions of all of the drives in this roundup to investigate how larger capacity affects the performance of the different drives. I’m expecting some surprises.
Write Test — Disk Fill Summary
Update Dec 30, 2020:
I noticed some irregularities in the Disk Fill Summary section and have updated the way that I generate the graphs. This changes the values shown from when this review went live, but the underlying data and test methodology are unchanged. I’ve updated the narrative to reflect the new numbers.
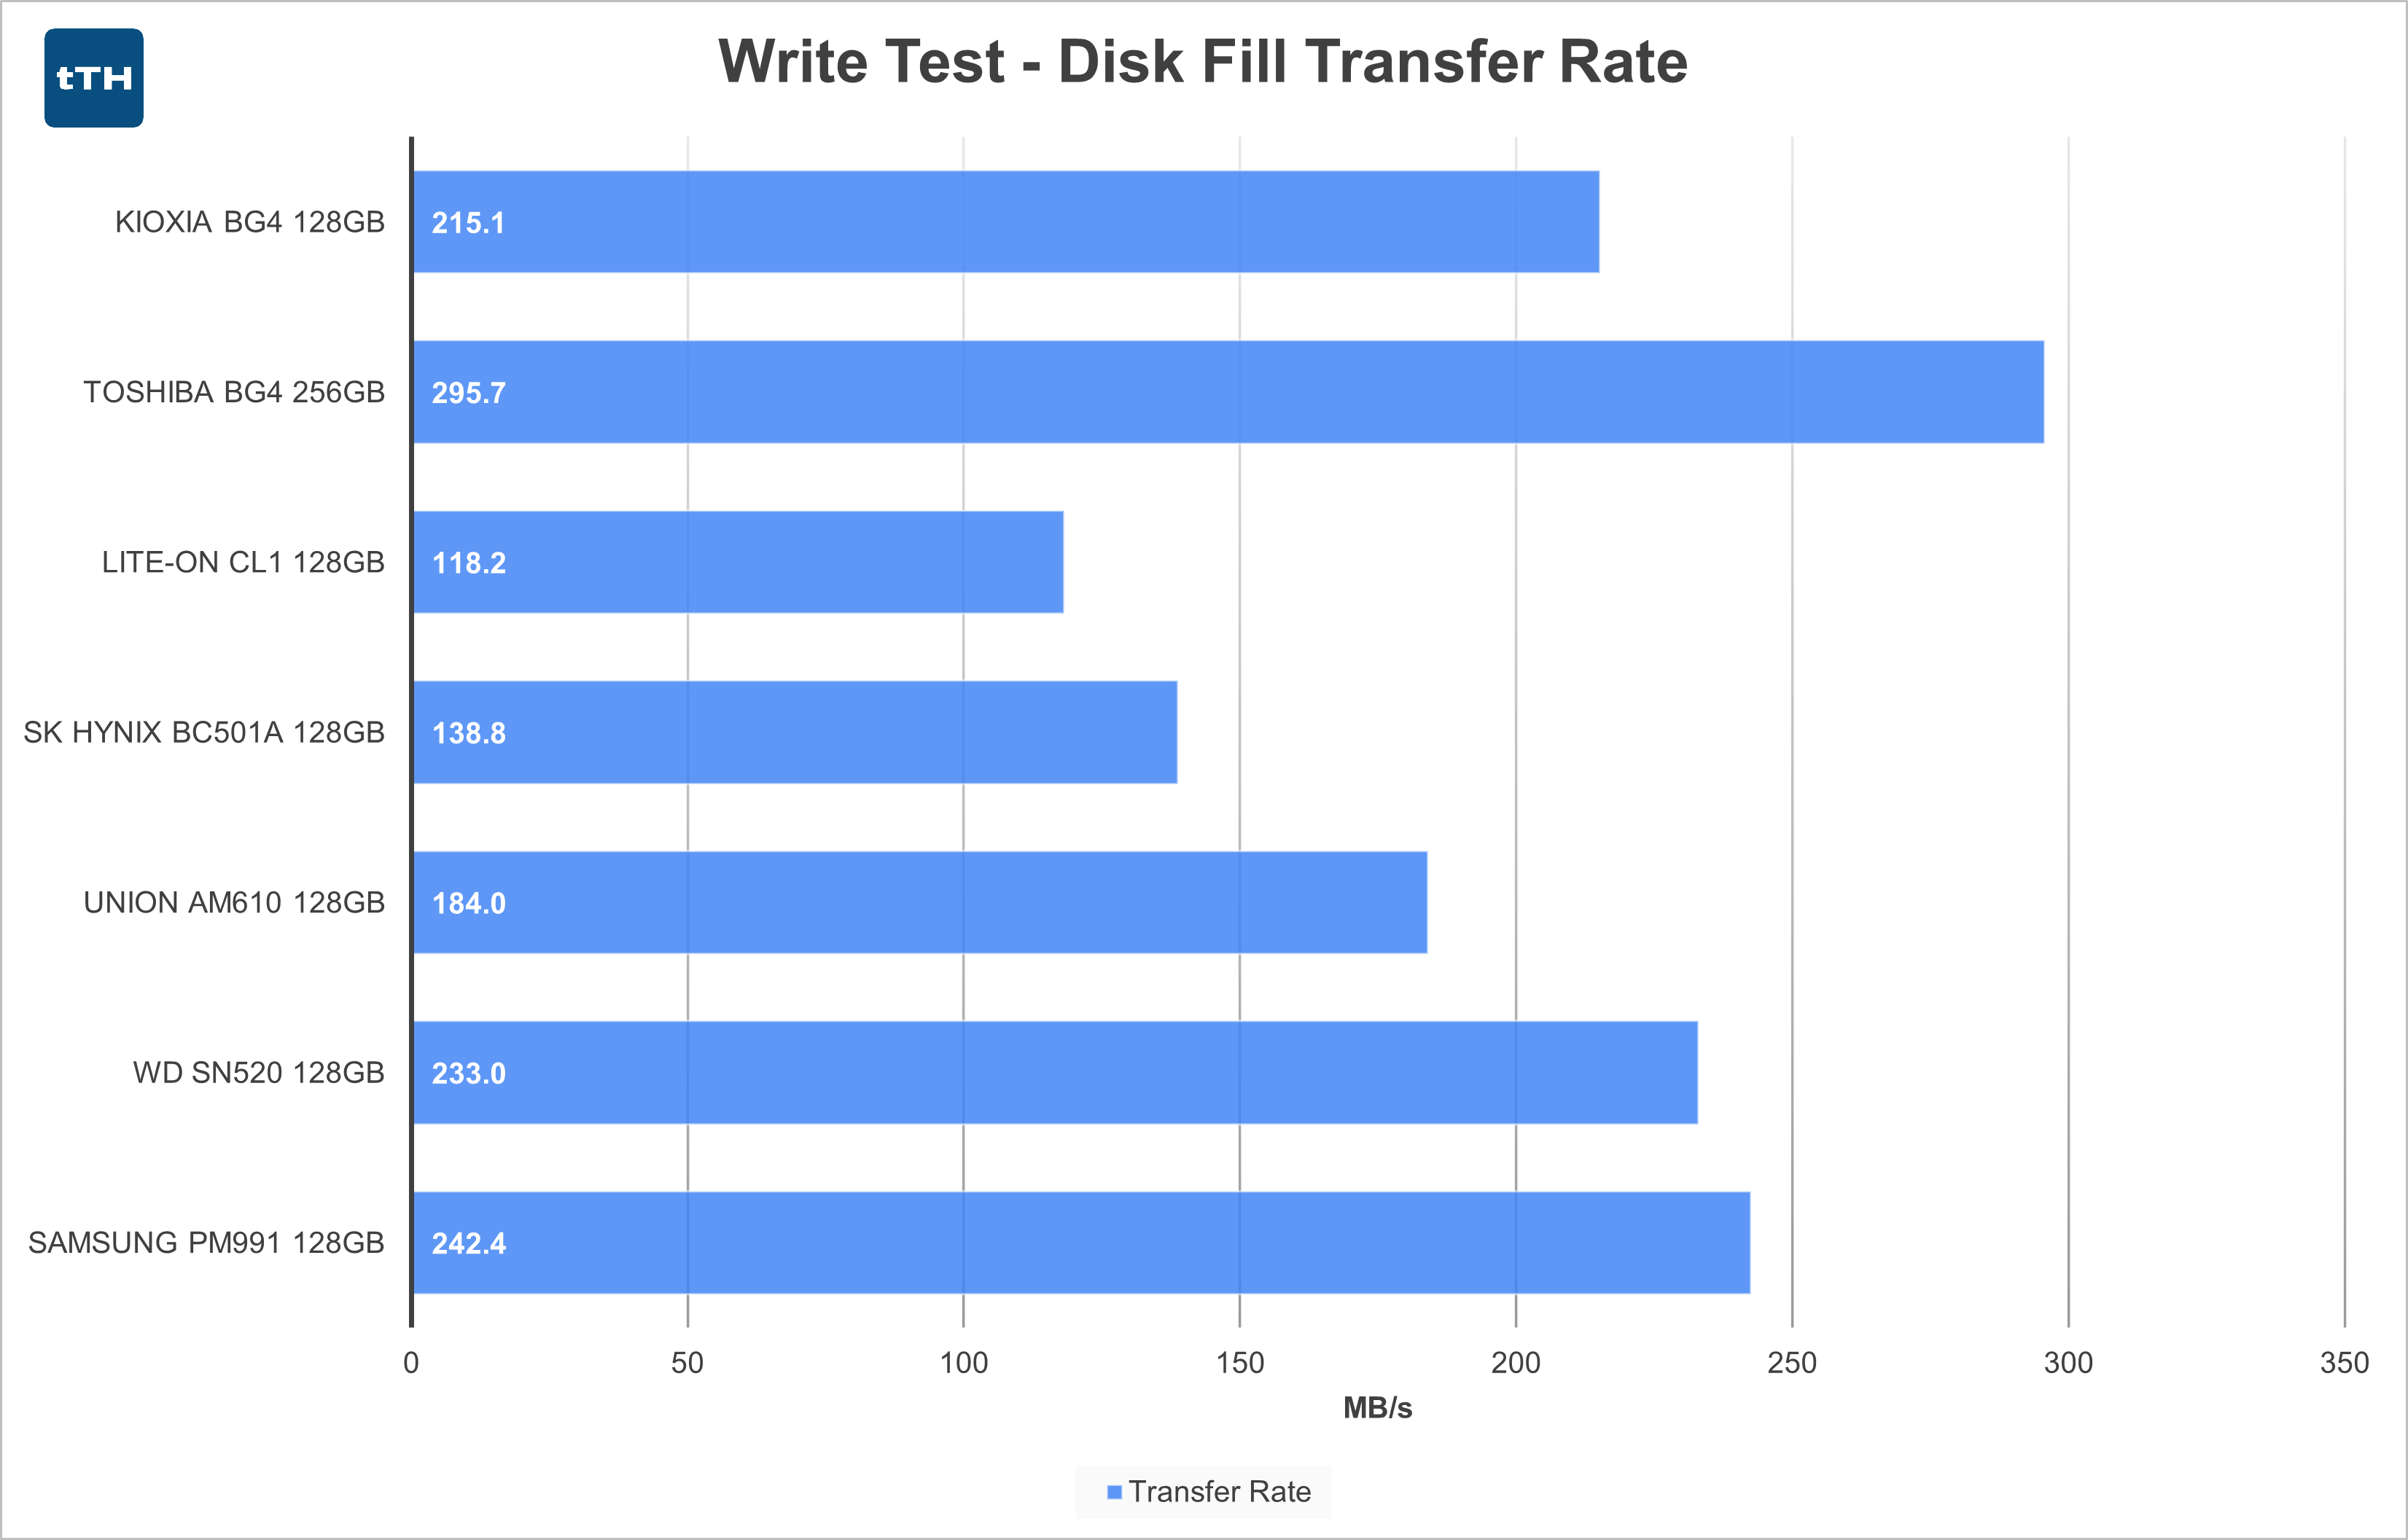
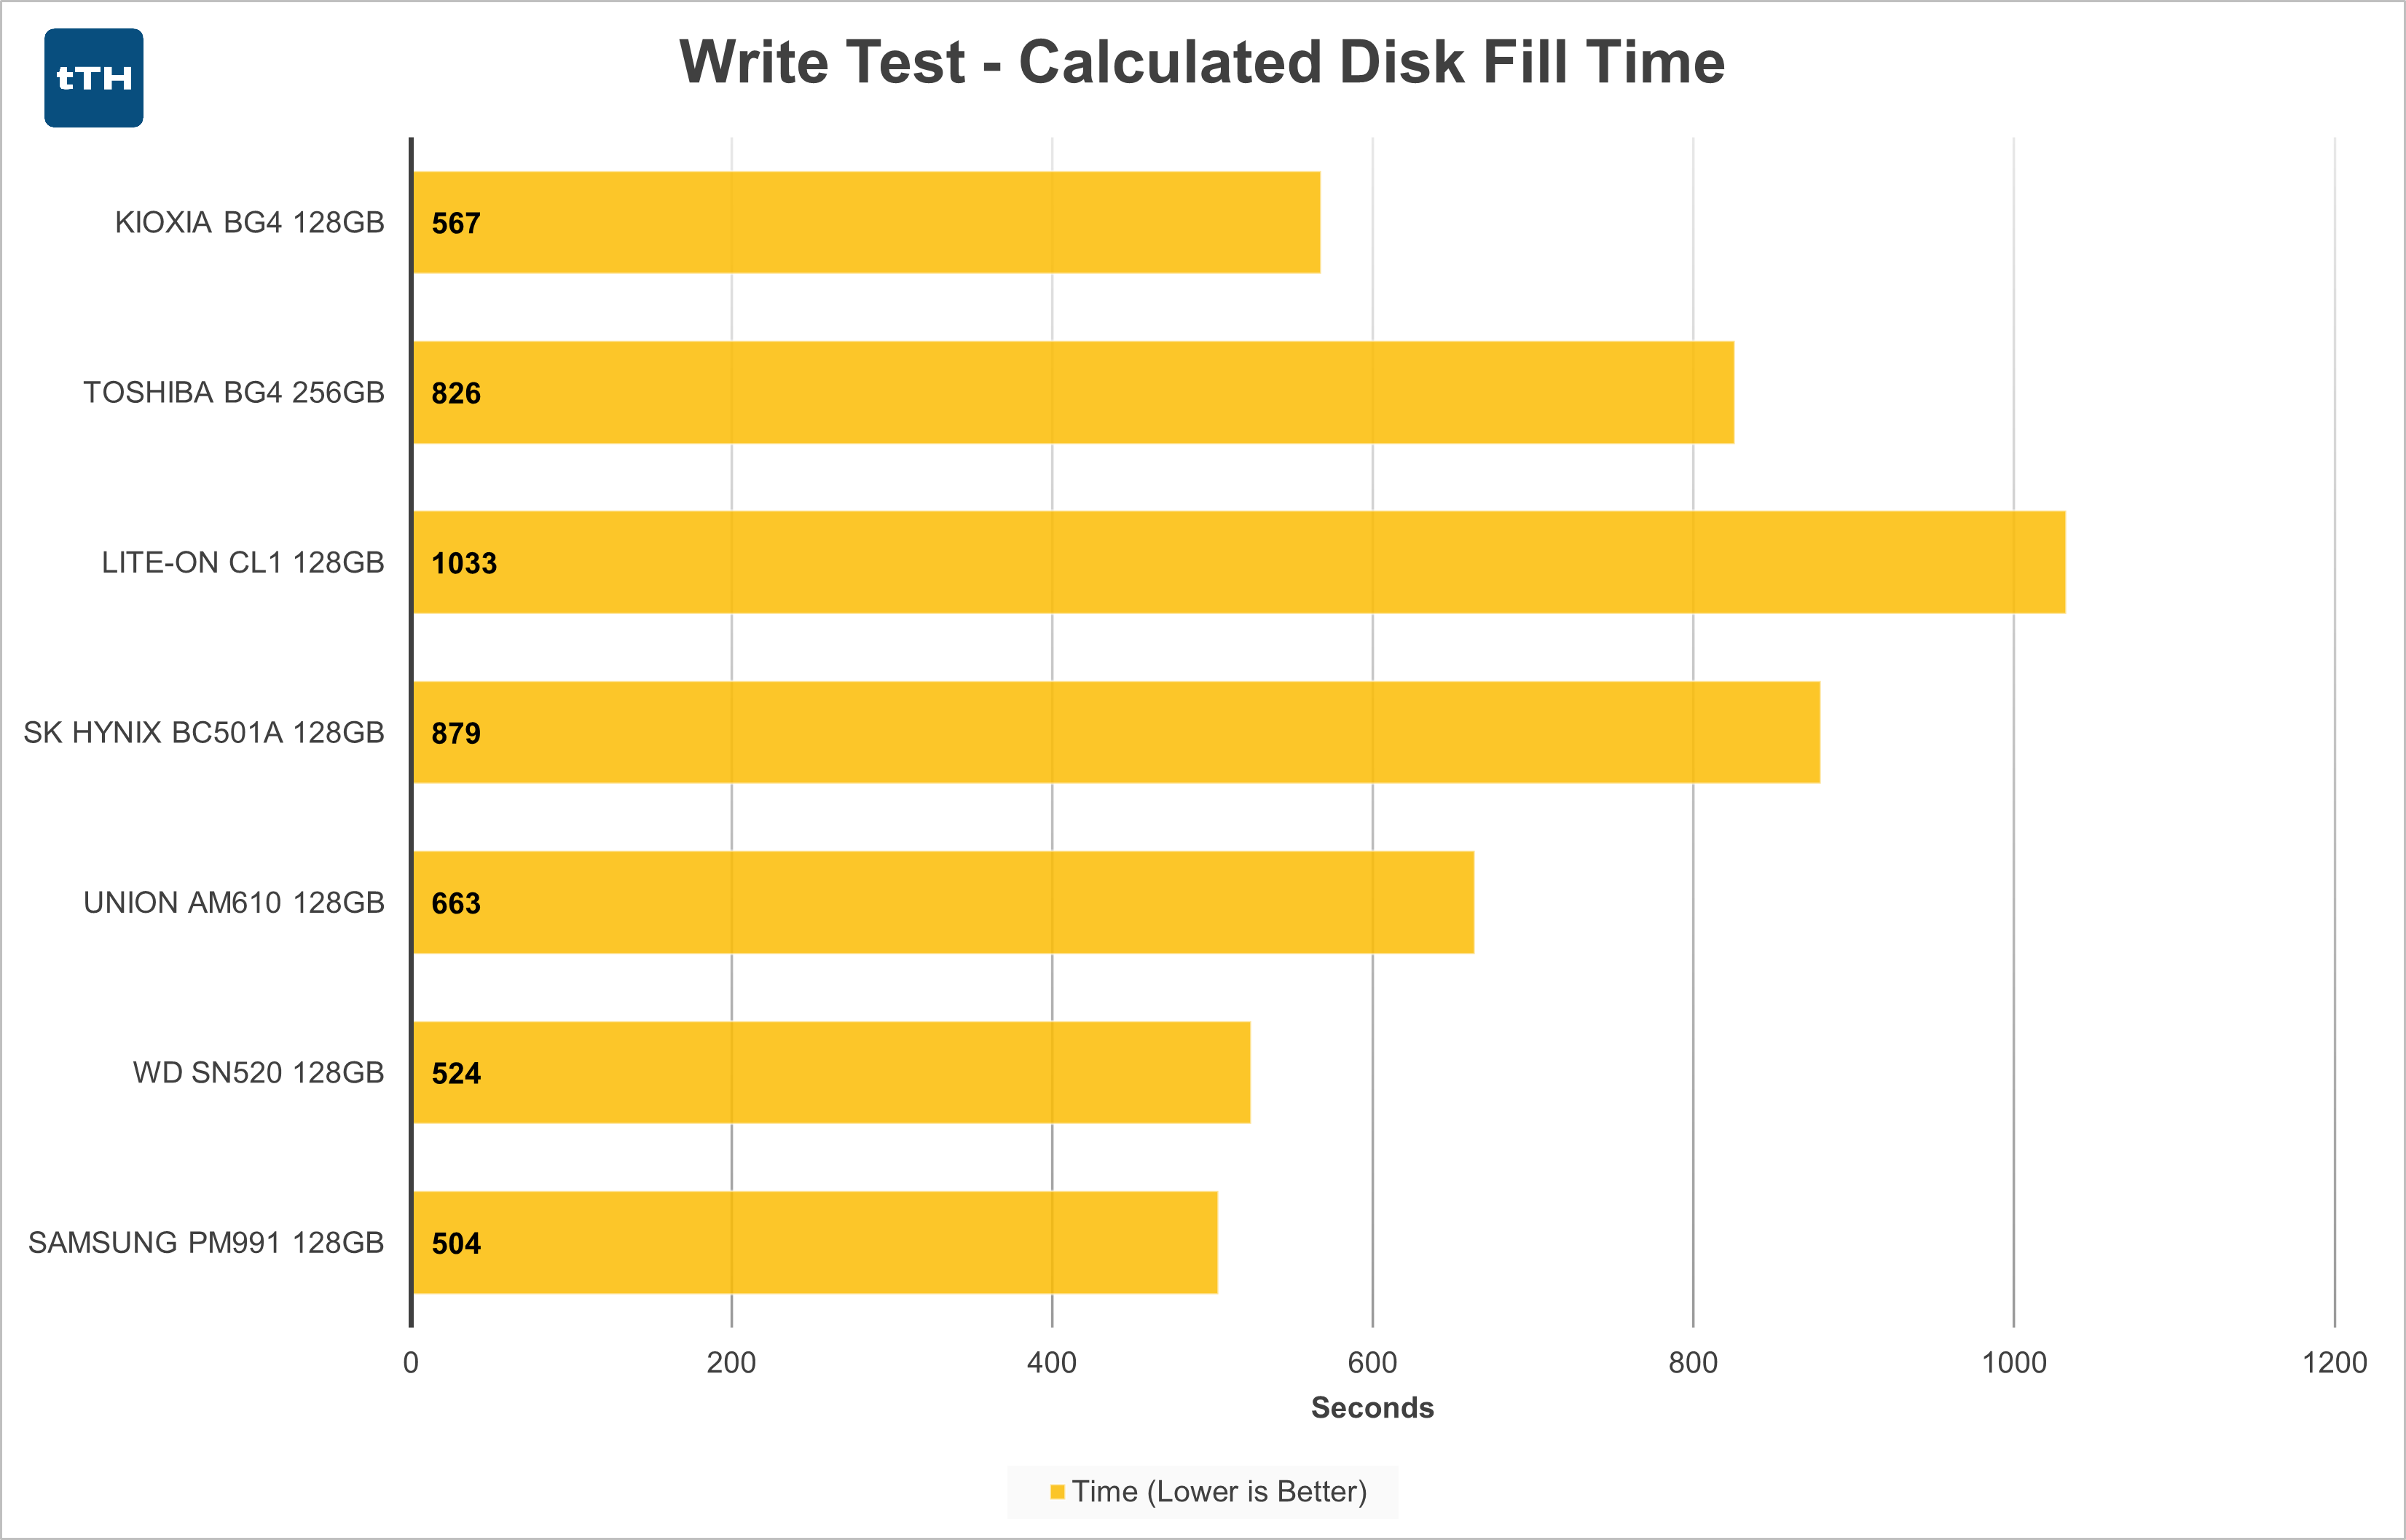 If all you’re looking for is transferring large files using one of these drives, the SN520, PM991, and both capacities of BG4 stand out from the rest. They all had average write speed across 100% of the drive exceeding 200MB/s. I calculated the disk fill time by taking drive capacity in MB and dividing the average write speed measured in each test. Just note, some of the drives show particularly poor performance at the end of their capacity. If you’re intending to transfer files that are, say, only 60GB, the performance of several drives improves a bit compared to the whole-drive average but doesn’t disrupt the overall rankings too much.
Write Test — Disk Fill Per Drive
Kioxia BG4 128GB
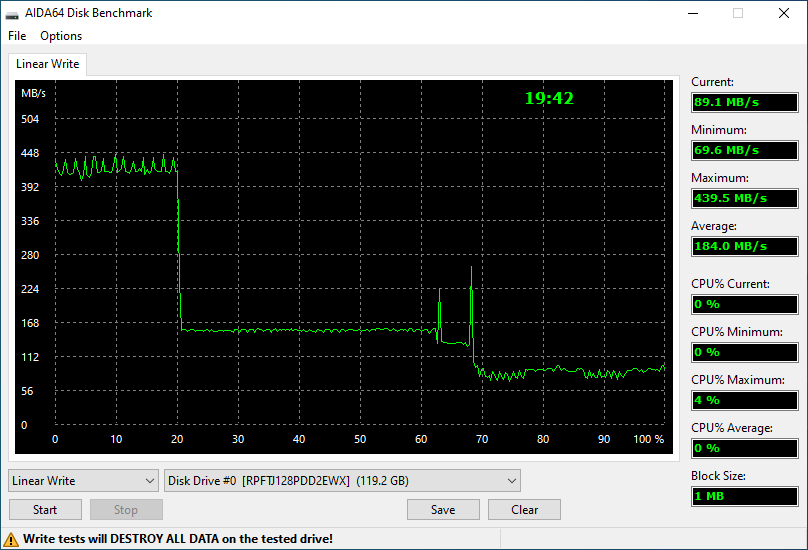
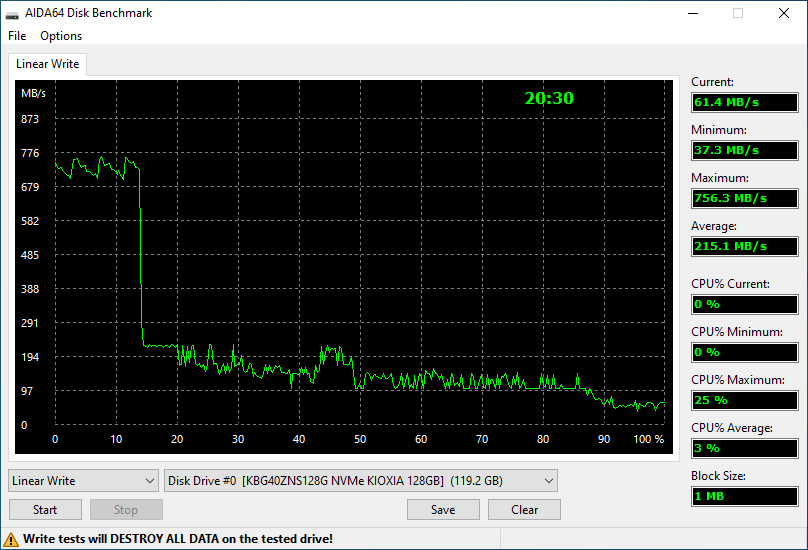 The 128GB BG4 has a moderately sized SLC cache for its capacity, weighing in at just under 15% of total drive capacity — or around 17GB. In the SLC portion of the drive, write speeds fluctuate between roughly 700 and 756MB/s. After the write cache is exhausted, writes drop to just over 200MB/s and then slowly degrade as the drive fills, bottoming out at around 50MB/s once the drive is over 90% full.
The high cached performance is good for bursty workloads, but the low sustained performance is indicative of the penalties low-capacity drives will face with low NAND parallelism. Average write speed while filling the entire drive is reported as 215MB/s by AIDA64, though I’ll be calculating this differently in my summary of the disk-fill metric.
Toshiba BG4 256GB
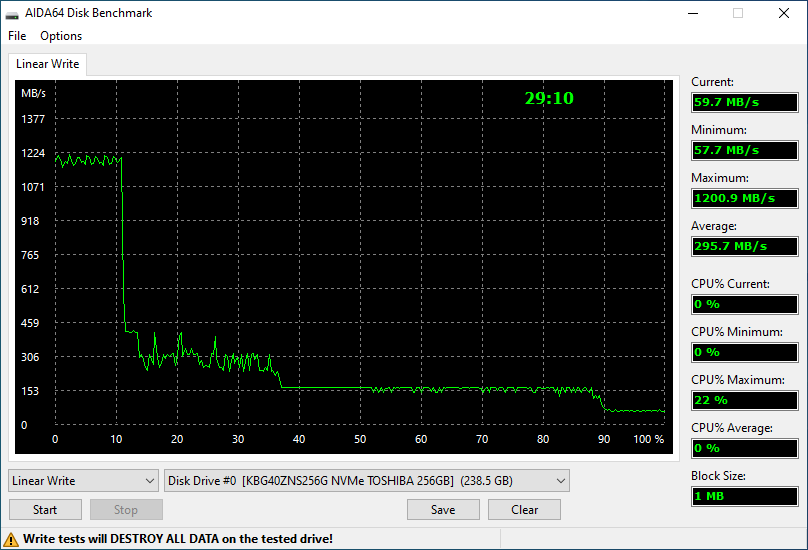 The 256GB BG4 only has about 11% of its usable capacity as SLC cache, a lower percentage than the 128GB model. Yet this still accounts for approximately 26GB of write cache. As expected, the cache is also faster than on the 128GB variant, reaching about 1200MB/s, also with less fluctuation. The non-cached performance settles at around 300MB/s until about 37% of drive capacity, where it hits a pretty solid steady state of about 155MB until degrading further to about 70MB/s at 90% full.
Despite being twice the capacity of the 128GB BG4, the drive filled in significantly less than twice the time of the 128GB variant, due to an increased average write speed of 295MB/s.
Lite-On CL1 128GB
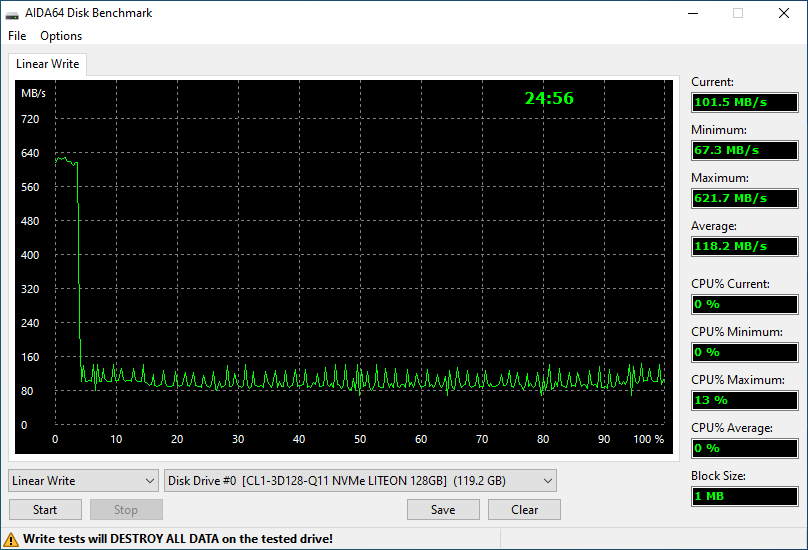 The CL1’s peak-performance SLC cache only lasts for about 5% of the drive’s capacity — so about 6GB. It is also a bit slower than the BG4 at around 620MB/s. After that, performance falls sharply to between 80 and 150MB/s, constantly fluctuating between peaks and valleys. That said, overall performance is relatively consistent until the drive fills completely, albeit at a pretty low level of performance.
Due to the small SLC cache and low native TLC write speeds, the drive averages only 118MB/s across the whole drive.
SK Hynix BC501A 128GB
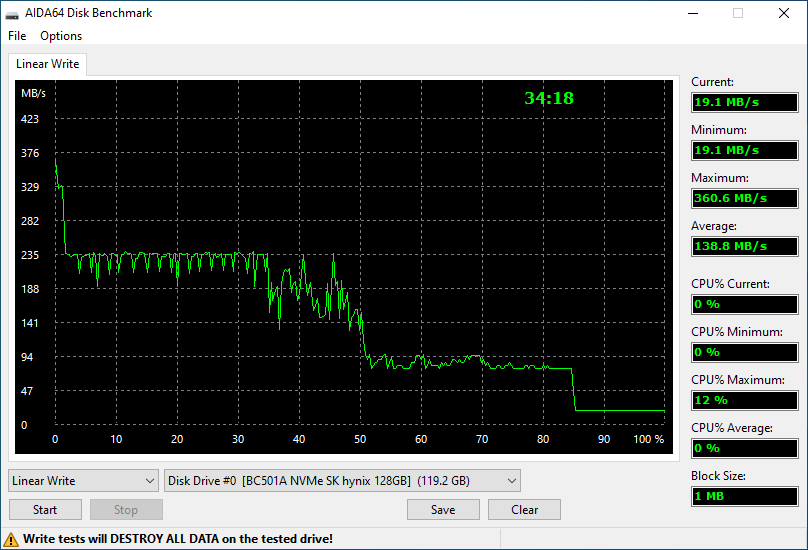 The BC501A’s write speeds are definitely not thrilling. SLC performance peaks at only 360MB/s for maybe 1-2% of drive capacity and then falls almost immediately to 235MB/s with intermittent drops in performance. At around 35% full, the drive’s performance becomes much less consistent and bounces between approximately 140 and 200MB/s. At around 50% full, the drive falls further to around 80MB/s and then falls off another cliff at around 85% full, this time to around 20MB/s.
This drive definitely shows pretty poor write performance — falling well within what even a decent SATA SSD achieves for most of its capacity, but then even underperforming spinning disks past 85% capacity. Not a great showing. Despite the average write speed being listed as 138MB/s, the abysmal performance at the end of the drive results in the last ~18GB taking around 16 minutes to complete.
Union AM610 128GB
 The AM610 doesn’t quite reach its rated 490MB/s sequential write speed, seeming to fluctuate between 400 and445MB/s. The SLC cache is exhausted right at 20% of the drive’s capacity resulting in around 24GB of fast writes. Between 20% and 62% full, the drive has a very steady ~160MB/s (potentially owing to the DRAM) ~160MB/s. Things get a bit crazy between 63% and 68% full, but at 70% the drive settles back down and maintains around 80MB/s until full.
The average of the run is 184MB/s and finishes a bit faster than average for the 128GB/s drives to this point. Though better than the BC501A, this level of performance would be available to decent SATA SSDs as well.
WD SN520 128GB
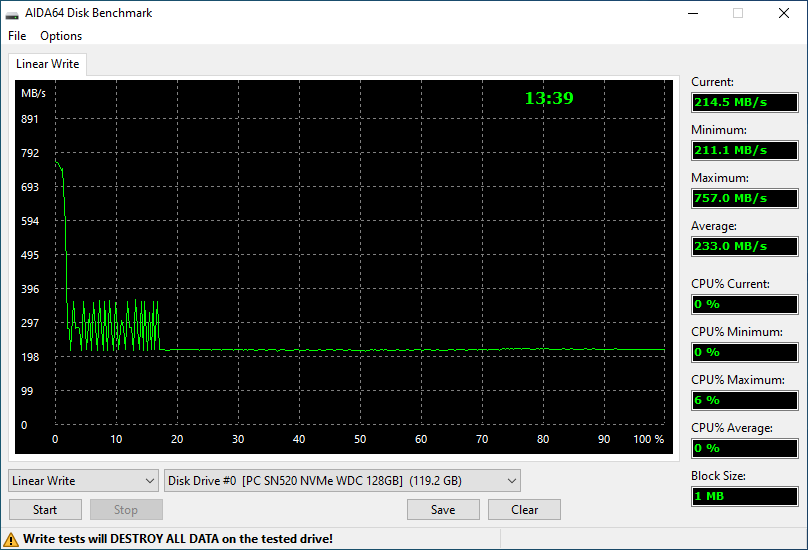 As the second of two drives with a PCIe 3.0 x2 interface and with the first one delivering less performance than I’d hoped, my expectations were more in-check for the SN520 — only to be blown out of the water. Peak performance is in line with the higher performing 128GB drives so far, but minimum (and thus average) performance was far more reasonable. As such, the drive posted the nearly fastest full-drive-write speed of 233MB/s.
SLC cache peaks at around 750MB/s but is exhausted after ~2.5% of drive capacity which is about 3GB. From there the drive bounces between an intermediate state of 350MB/s and a lower ~210MB/s until about 17% full. From 17% until the drive is filled, performance settles into a very steady state around 210MB/s.
Samsung PM991 128GB
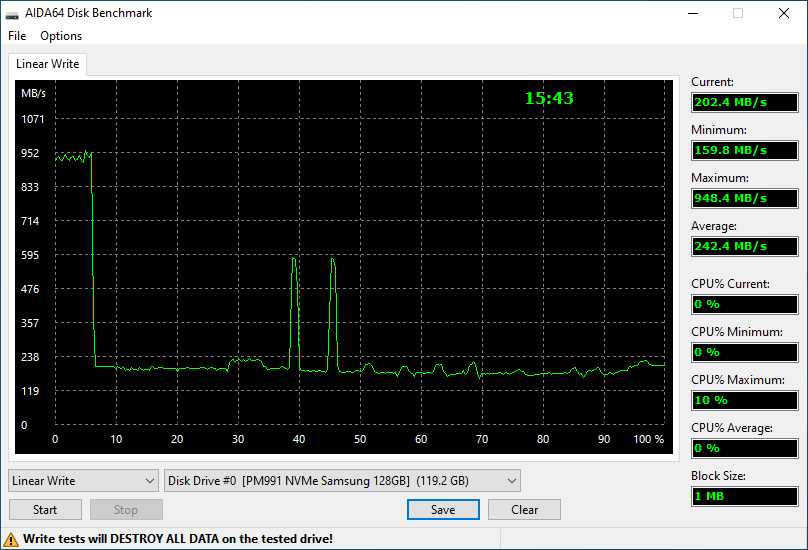 The PM991 does quite well overall. Peak SLC write speeds are just shy of 950MB/s and extend to maybe 7% of the drive’s capacity — about 8.3GB. Definitely great for completing bursty workloads quickly. After falling back to native TLC speeds, performance mostly hovers right around 200MB/s with a few spikes back up to almost 600MB/s.
Combined, this yields a 242.4MB/s average beating out the SN520 by a small margin.
AS-SSD Sequential Tests
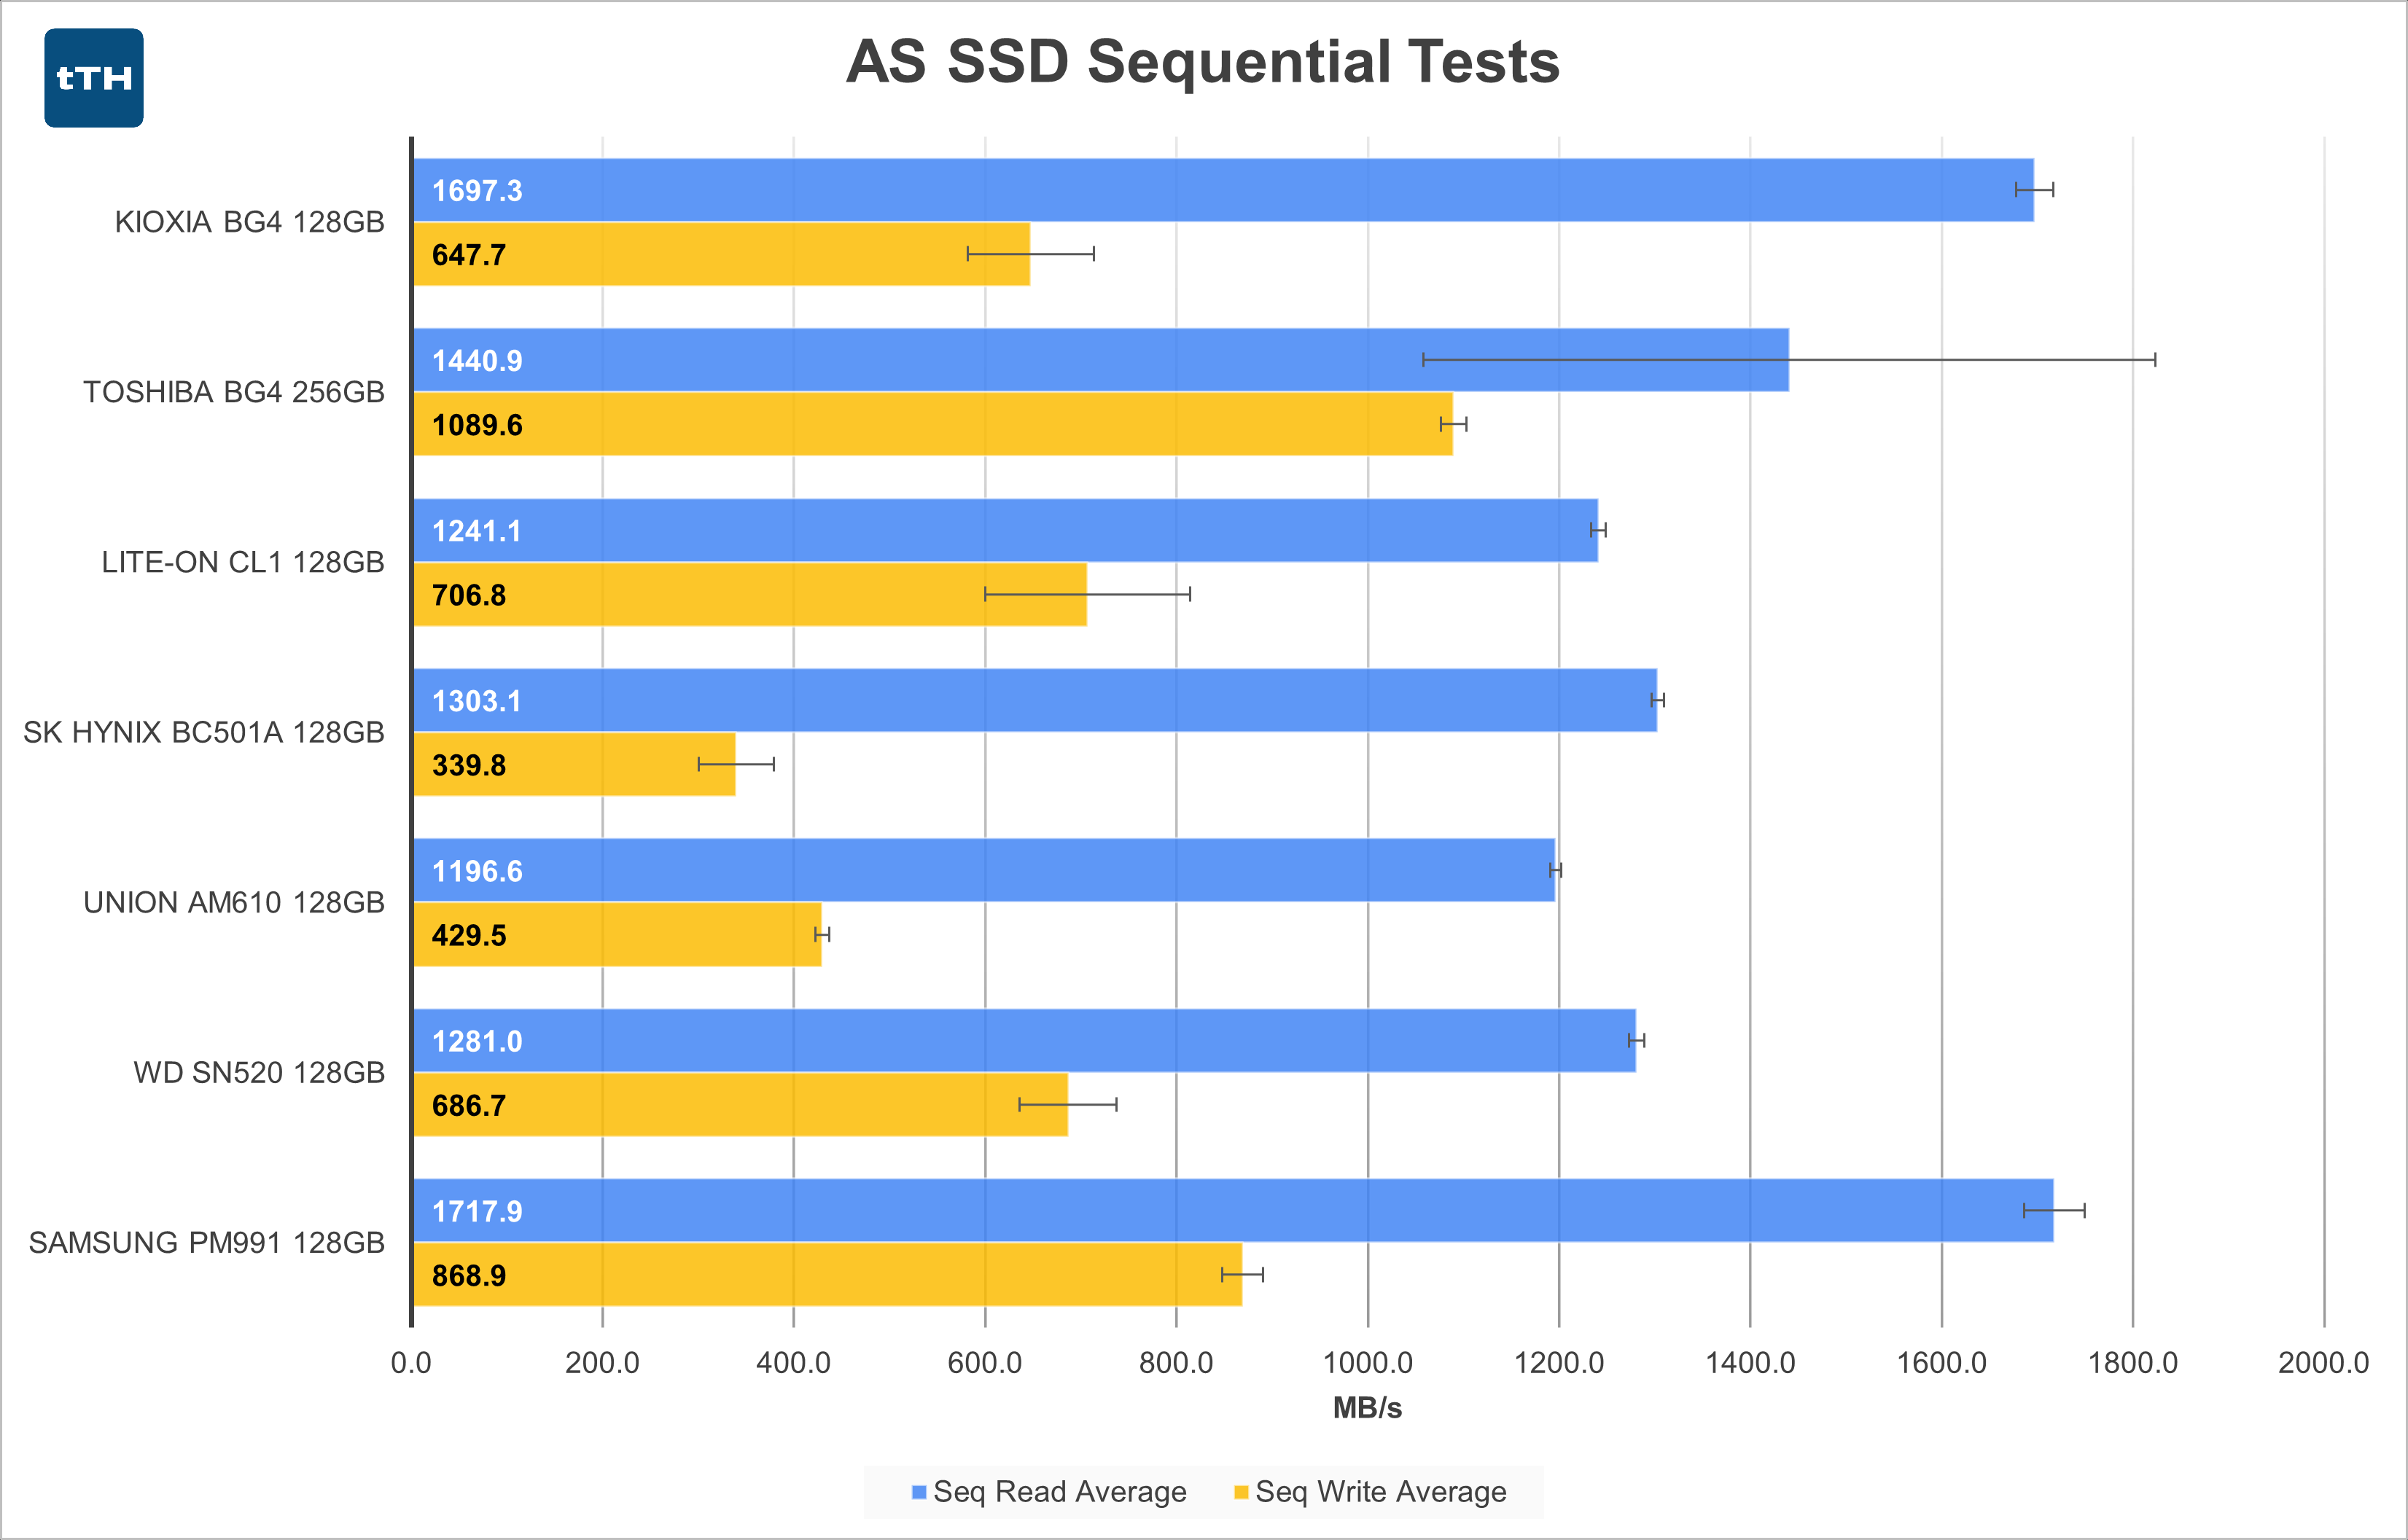 Out of the 128GB drives, the BG4 and PM991 stand out from the pack as having better Sequential Read performance of around 1700MB/s. The remaining 128GB drives all cluster around 1200-1300MB/s. The 256GB BG4 strangely had wildly fluctuating Sequential Reads from run to run, as indicated by the extremely large error bars. While testing I thought that this was a fluke, but the drive consistently delivered inconsistent performance in this test.
For Sequential Writes, among the 128GB drives, the PM991 leads the pack, followed by the CL1, SN520, and BG4. The AM610 and BC501A trail the other drives by a significant margin, each providing performance well within the limits of even a decent SATA SSD.
The x2 link on the SN520 doesn’t seem to hamper its performance compared to the other drives as it performs similarly or better than the CL1, AM610, and BC501A. The discrete RAM cache on the AM610 doesn’t seem to be doing it any favors.
AS-SSD 4K Tests
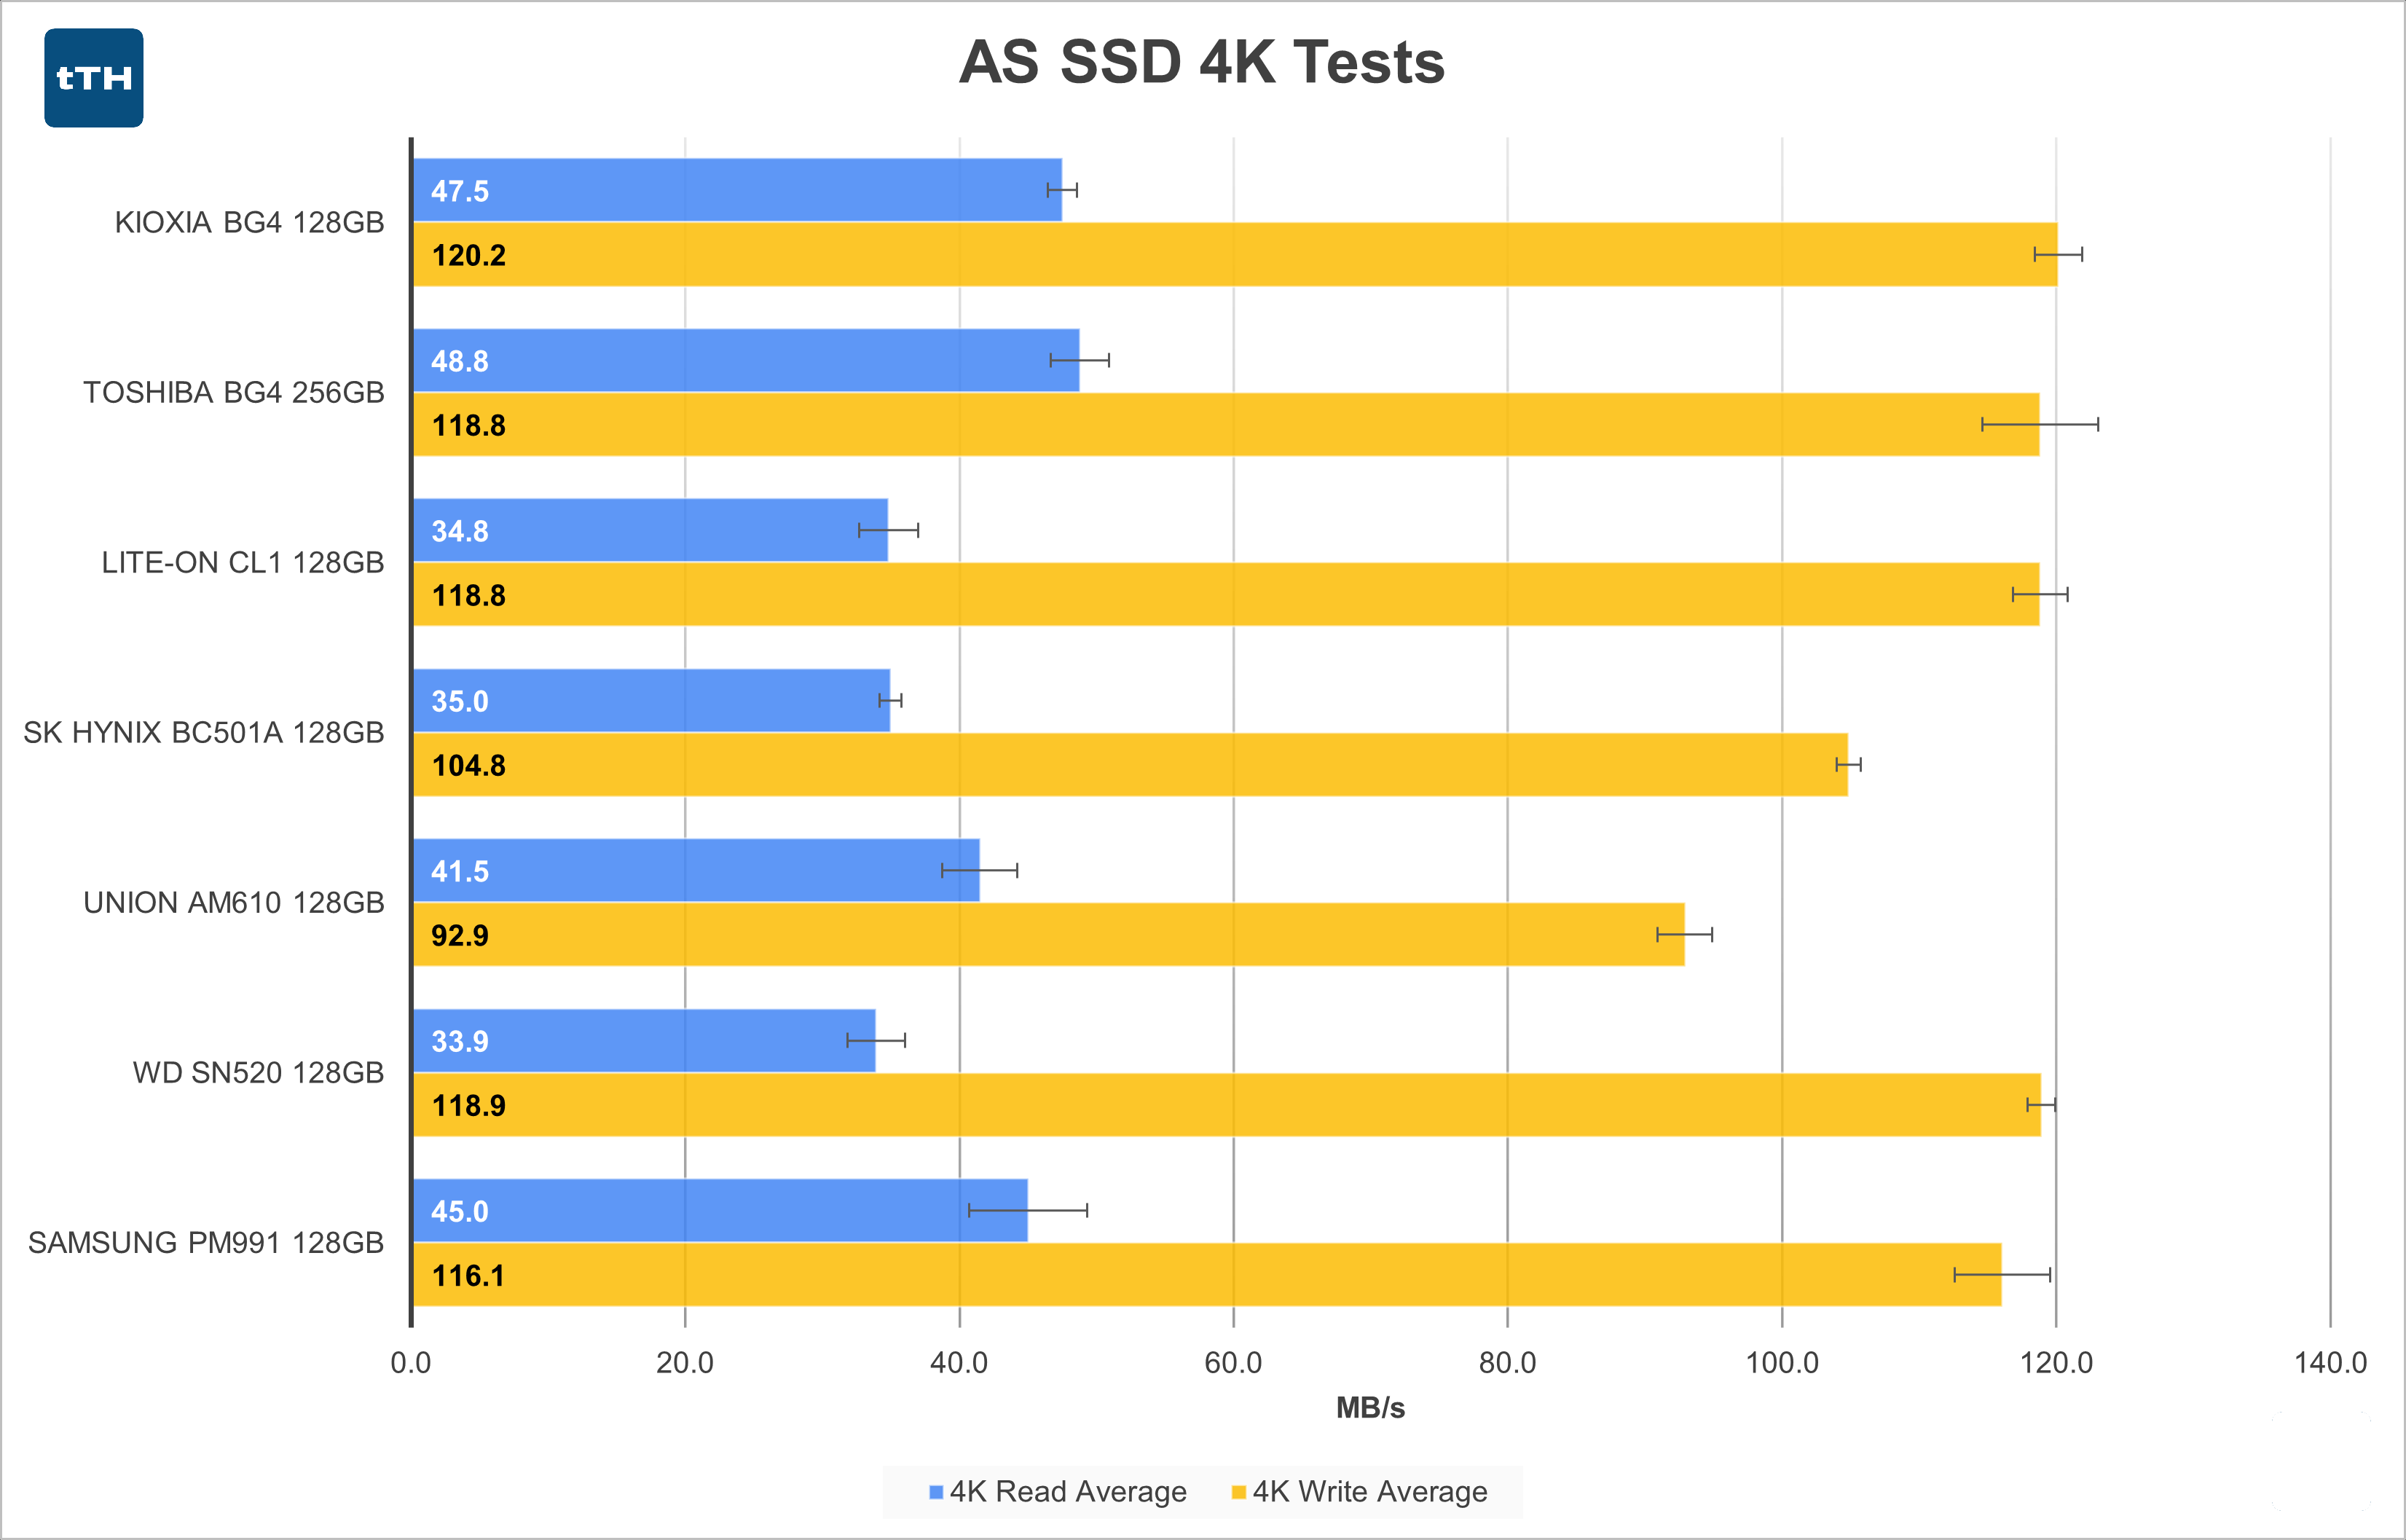 4K Random Read Performance seems to be relatively tightly grouped with the Reads for all drives ranging from 33.9MB/s to 48.4MB/s. The BG4, PM991, and AM610 are all above 40MB/s, with the BC501A, CL1, and SN520 all right around 35MB/s.
4K Random Write Performance is mostly a close grouping as well, with the BC501A and AM610 falling behind the pack. Particularly when compared to the other drives, which are likely all DRAMless, the AM610’s performance is both surprising and disappointing.
PCMark 8 Storage Test
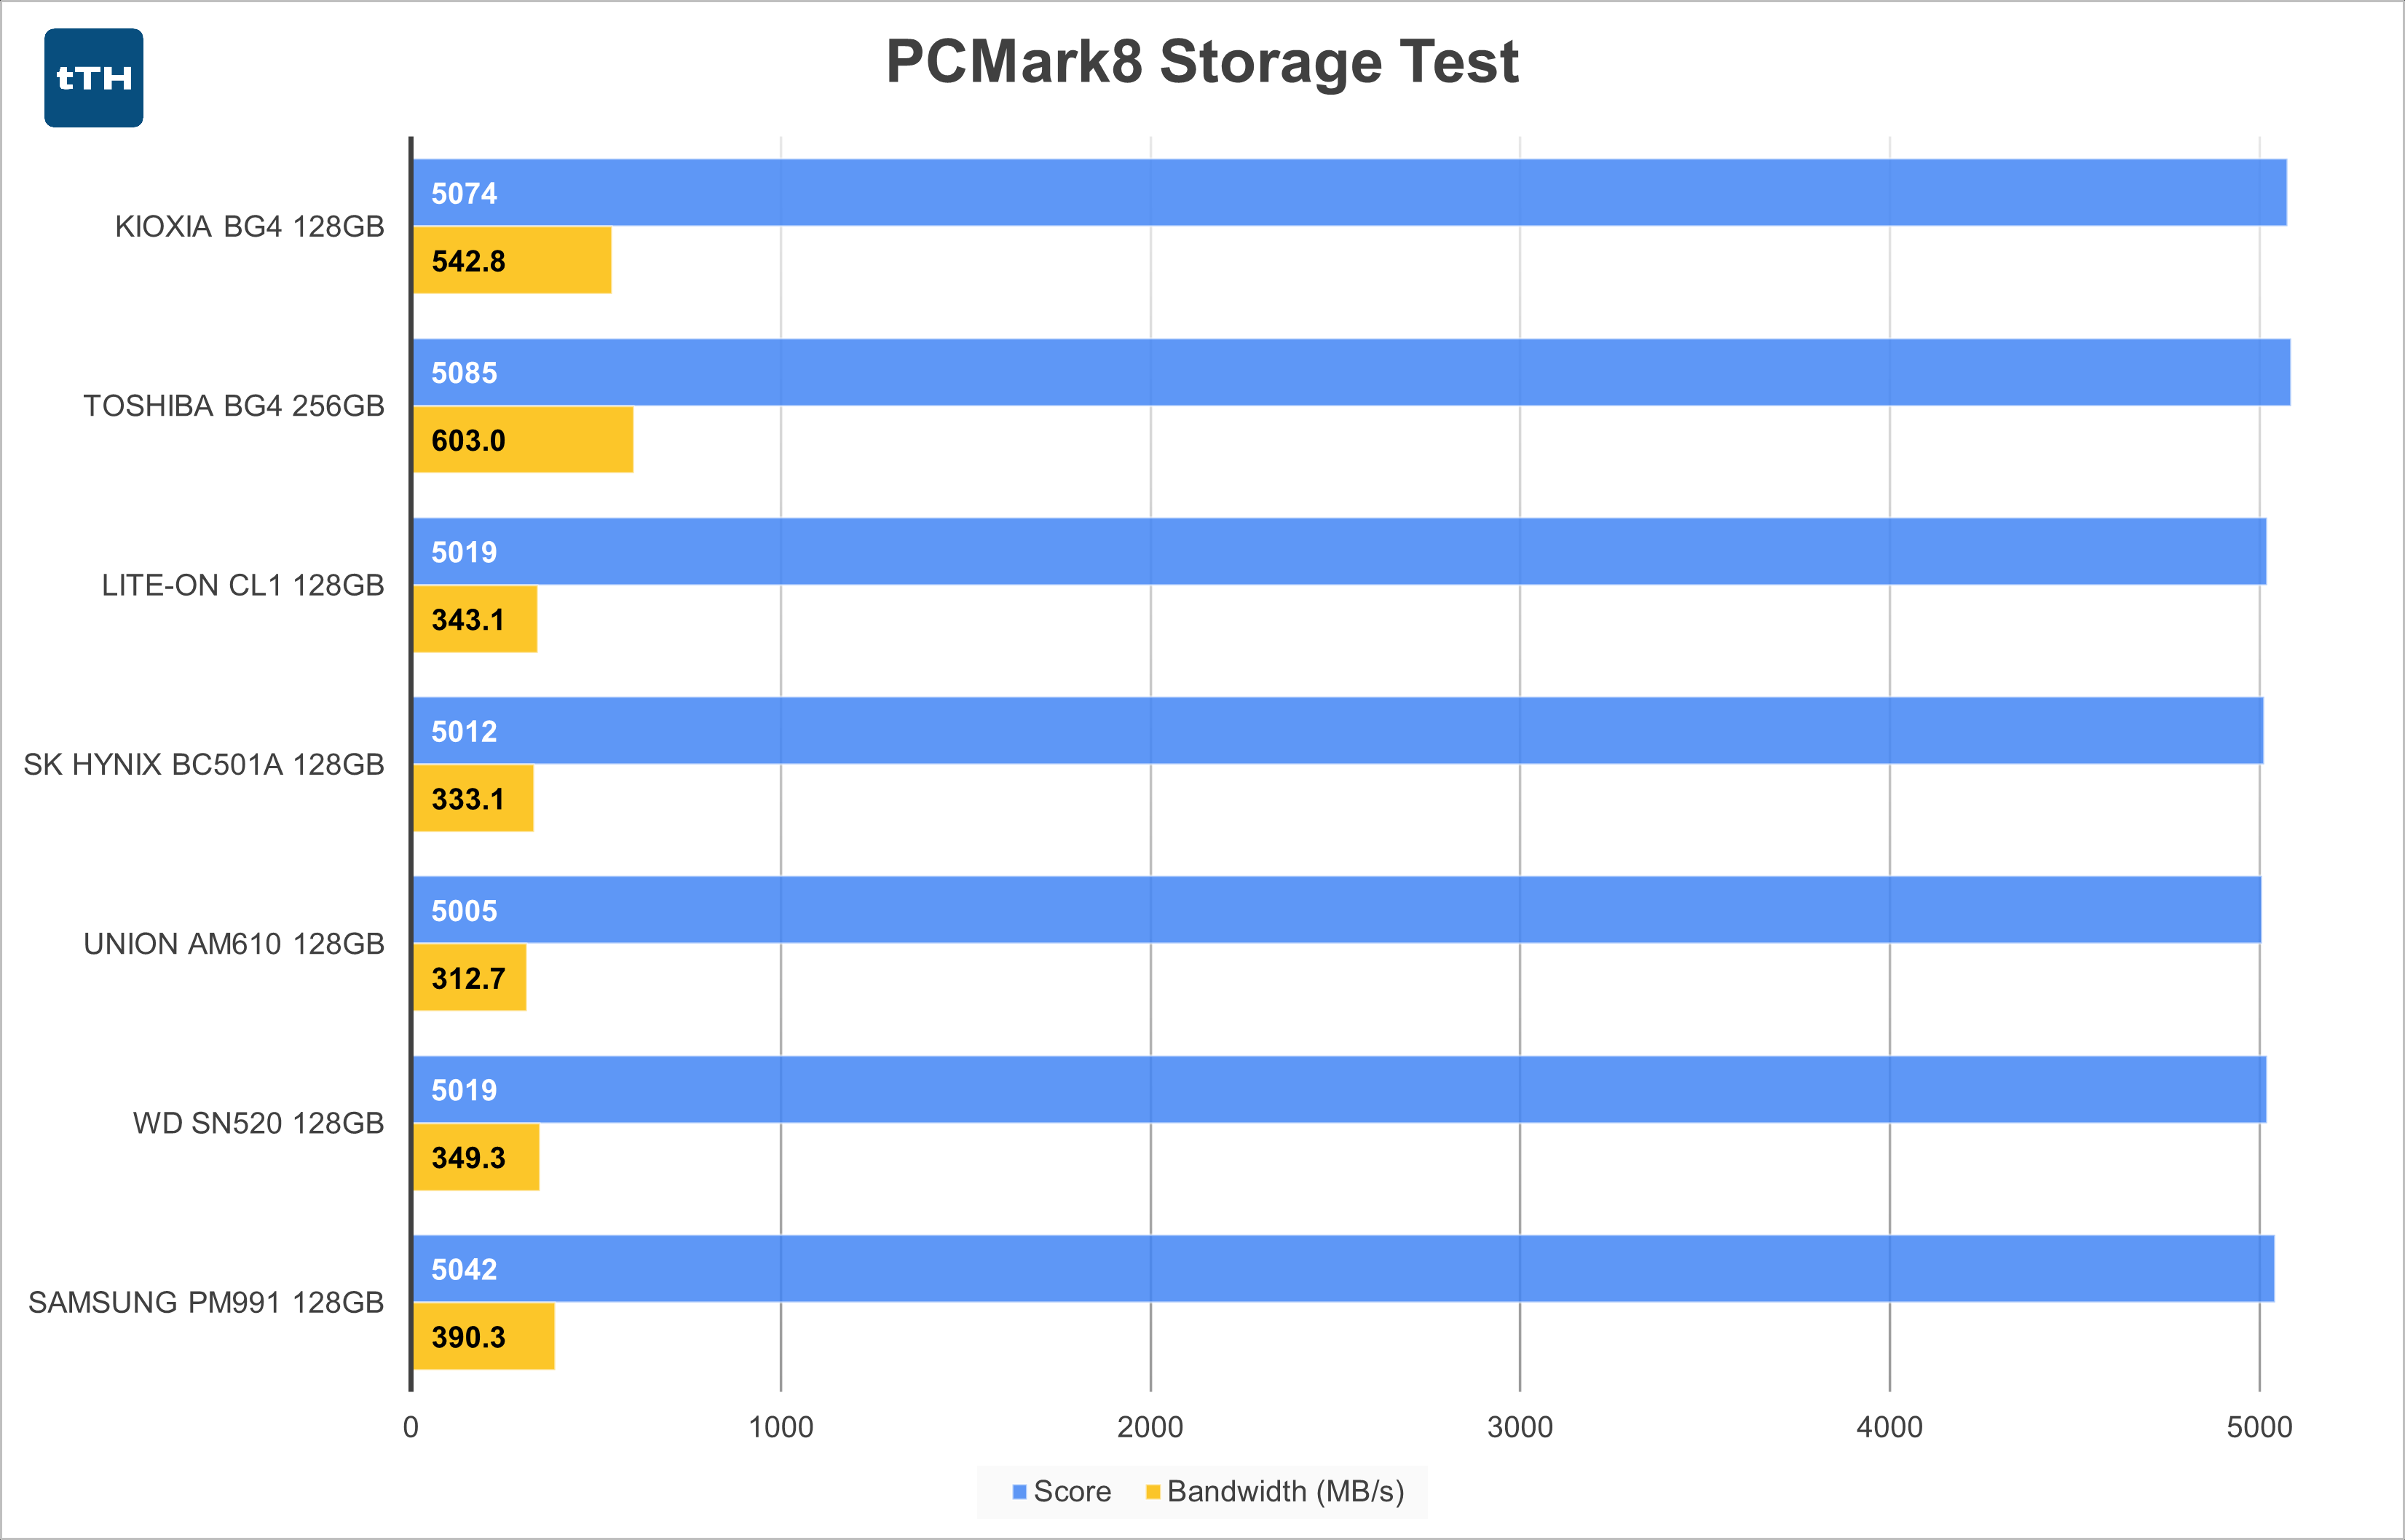 Probably one of the more useless tests in the lineup. The test replays saved traces of storage access patterns generated from real world tasks. The suite internally repeats each sub-test 3 times and then provides an average. The results seem to indicate performance in workloads whose performance isn’t bound by storage speed. For what it is worth, most day-to-day tasks aren’t really storage-bound as long as you have an SSD that’s not terrible, so the results are pretty real-world in that sense.
Poring over all of the data, the test results are pretty consistent for the three test runs being averaged. Subtests last anywhere from ~10 seconds to about 360 seconds, but the largest delta that exists between different drives on the longest test are only about 13 seconds (363.7 vs 350.8 seconds). Most other tests are within a second or even tenths of a second. As you can see from the graph, even large swings in calculated storage bandwidth lead to relatively small differences in overall score.
I’ll see if I can create some sort of scripted test that better represents a real-world workload that is at least somewhat storage-bound — maybe a file decompression task with lots of small files — but then that just becomes a random write test with a CPU component added in.
Large-File Transfer Tests
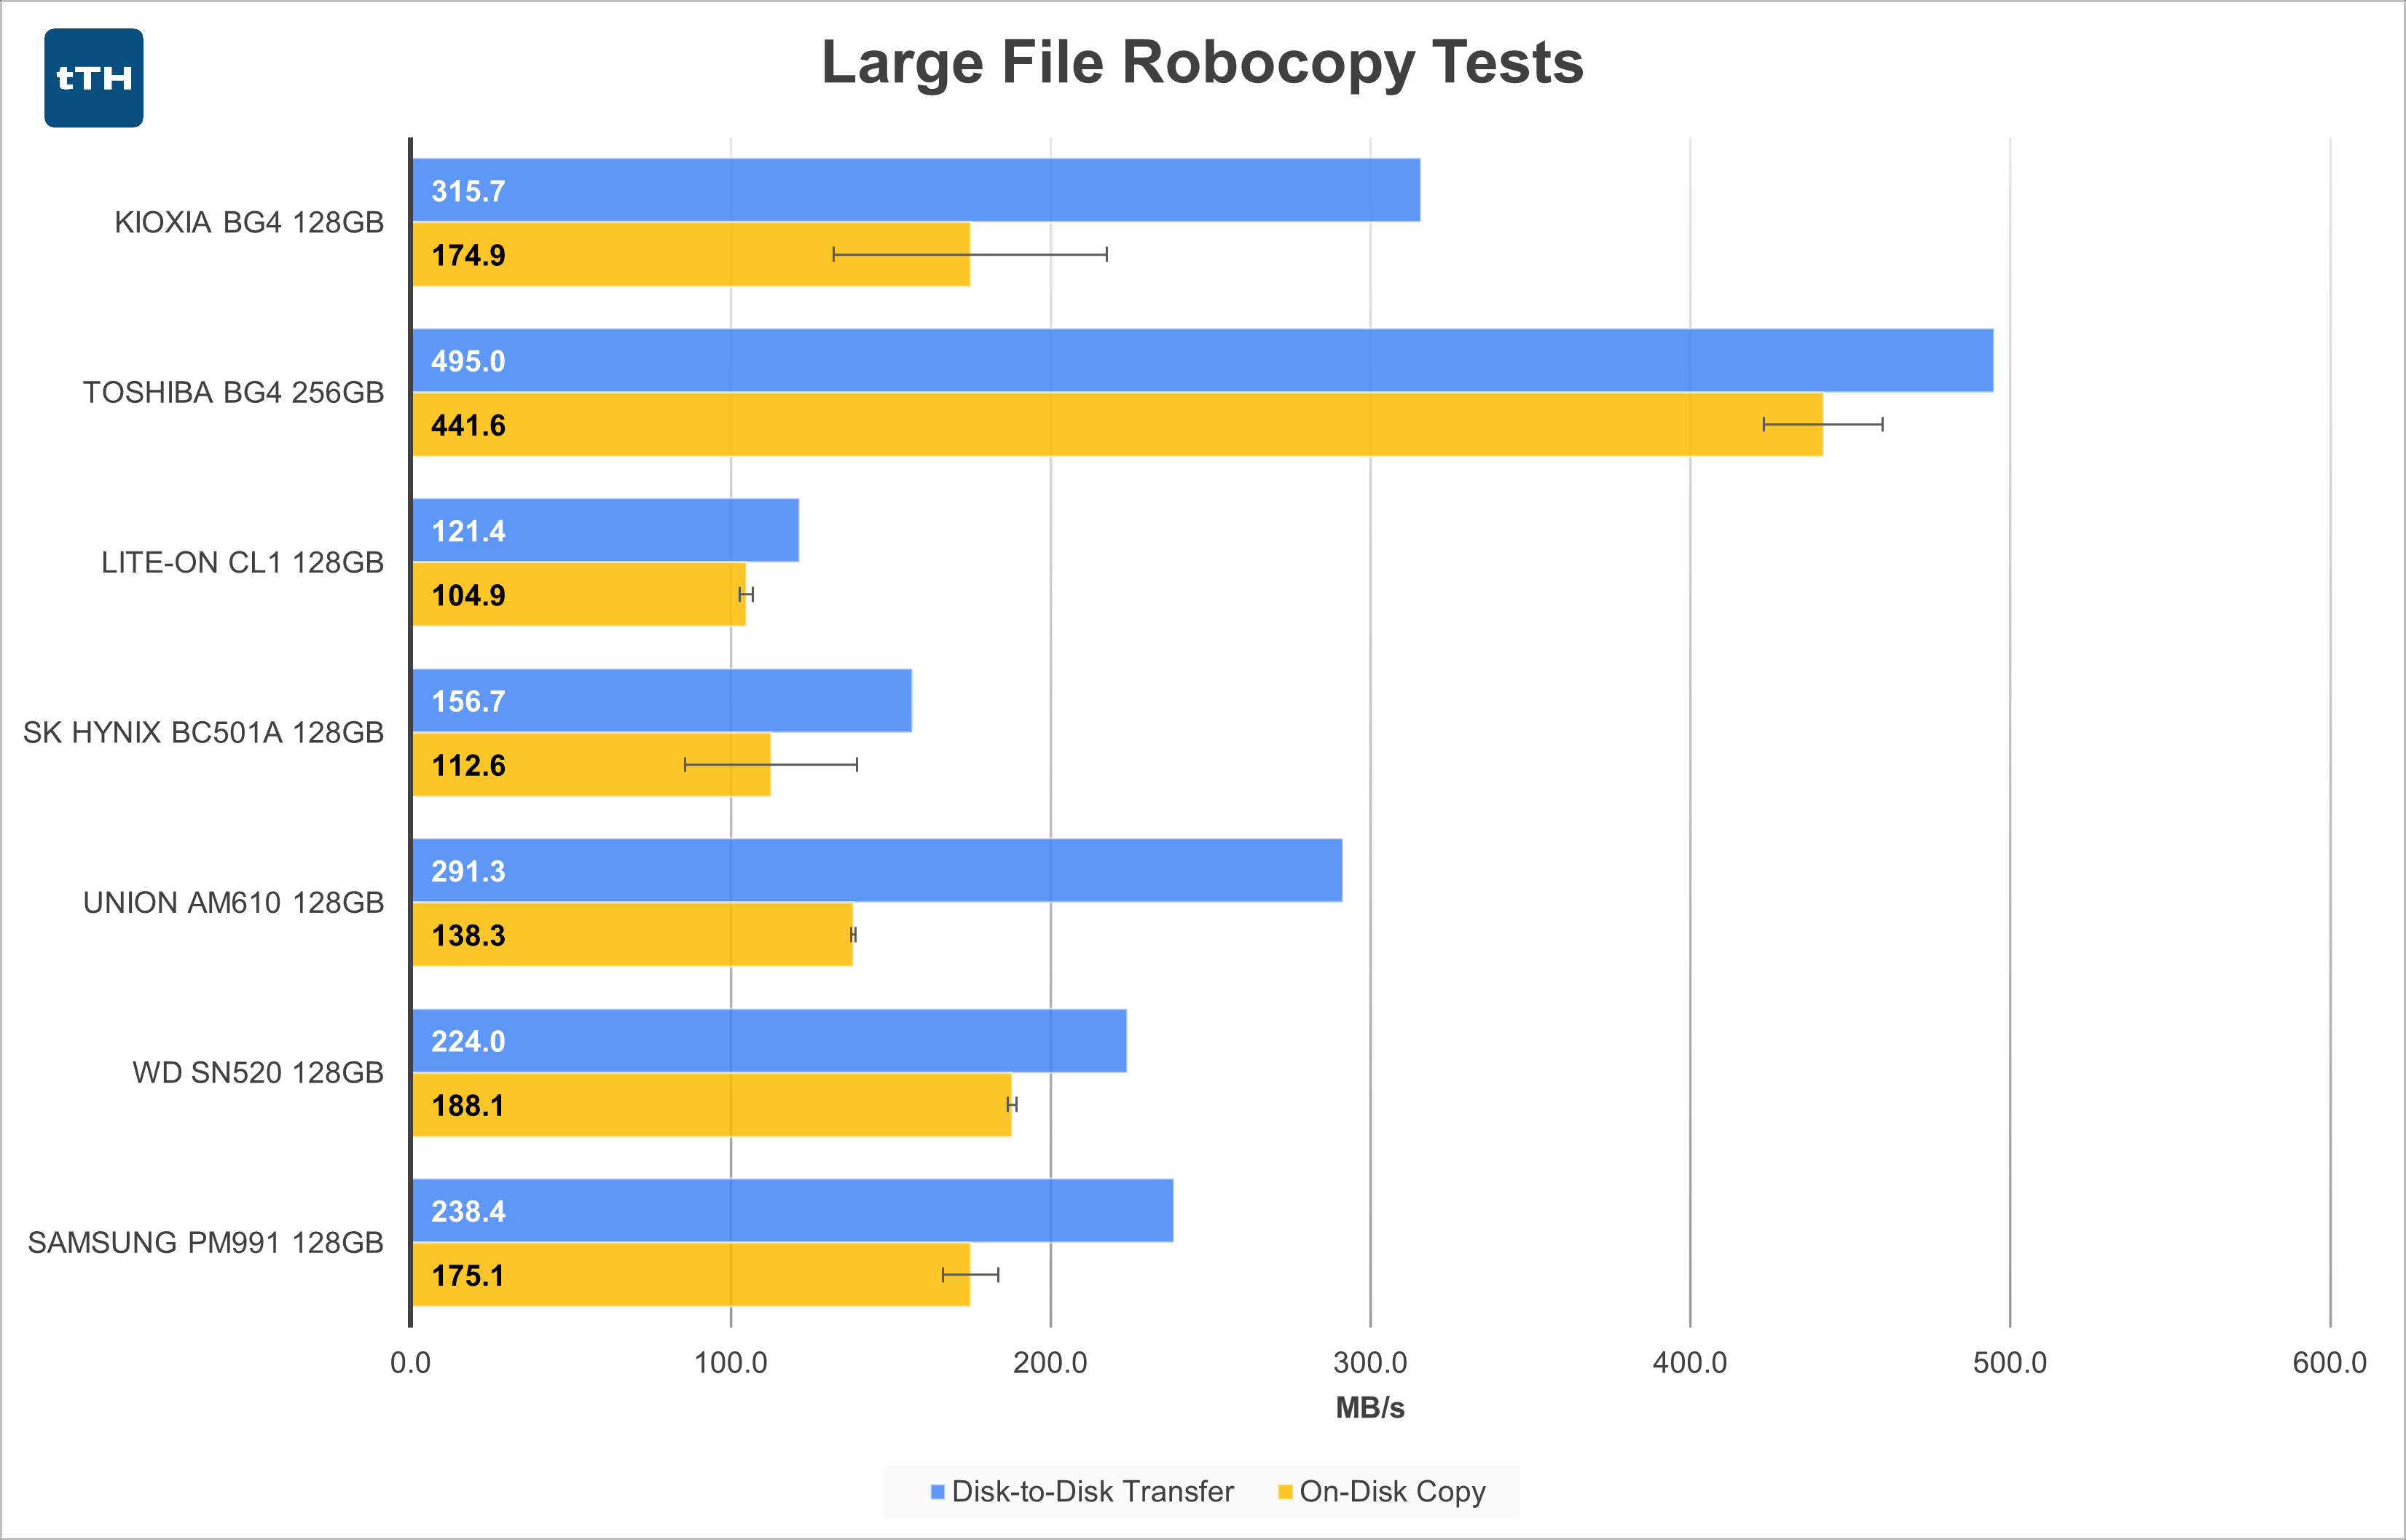 Dealing with what is mostly a 30GB sequential write from a source that peaks at 750MB/s, the File Transfer results mostly follow the average disk-fill rates. The BG4 leads the pack, and the AM610 falls not far behind, owing to their large SLC caches. The SN520 and PM991 seem to underperform compared to the full-disk write tests, but their smaller SLC caches explain the difference. Notably, the CL1 and BC501A swap positions, mostly due to the latter having an intermediate write performance level in the middle of the drive compared to the CL1 simply falling to a very low level after the SLC is exhausted.
The On-Disk Copy operations largely follow the Transfer numbers, just with somewhat lower performance, likely due to the drives having to spend a good chunk of time switching between reading and writing. The 128GB BG4 falls pretty far. It’s still towards the front of the pack, but its large lead is gone. Despite the DRAM, the AM610 (again) slows down quite a bit when performing simultaneous reads and writes. The CL1 doesn’t lose very much performance, but there was precious little to begin with.
Small-File Transfer Tests
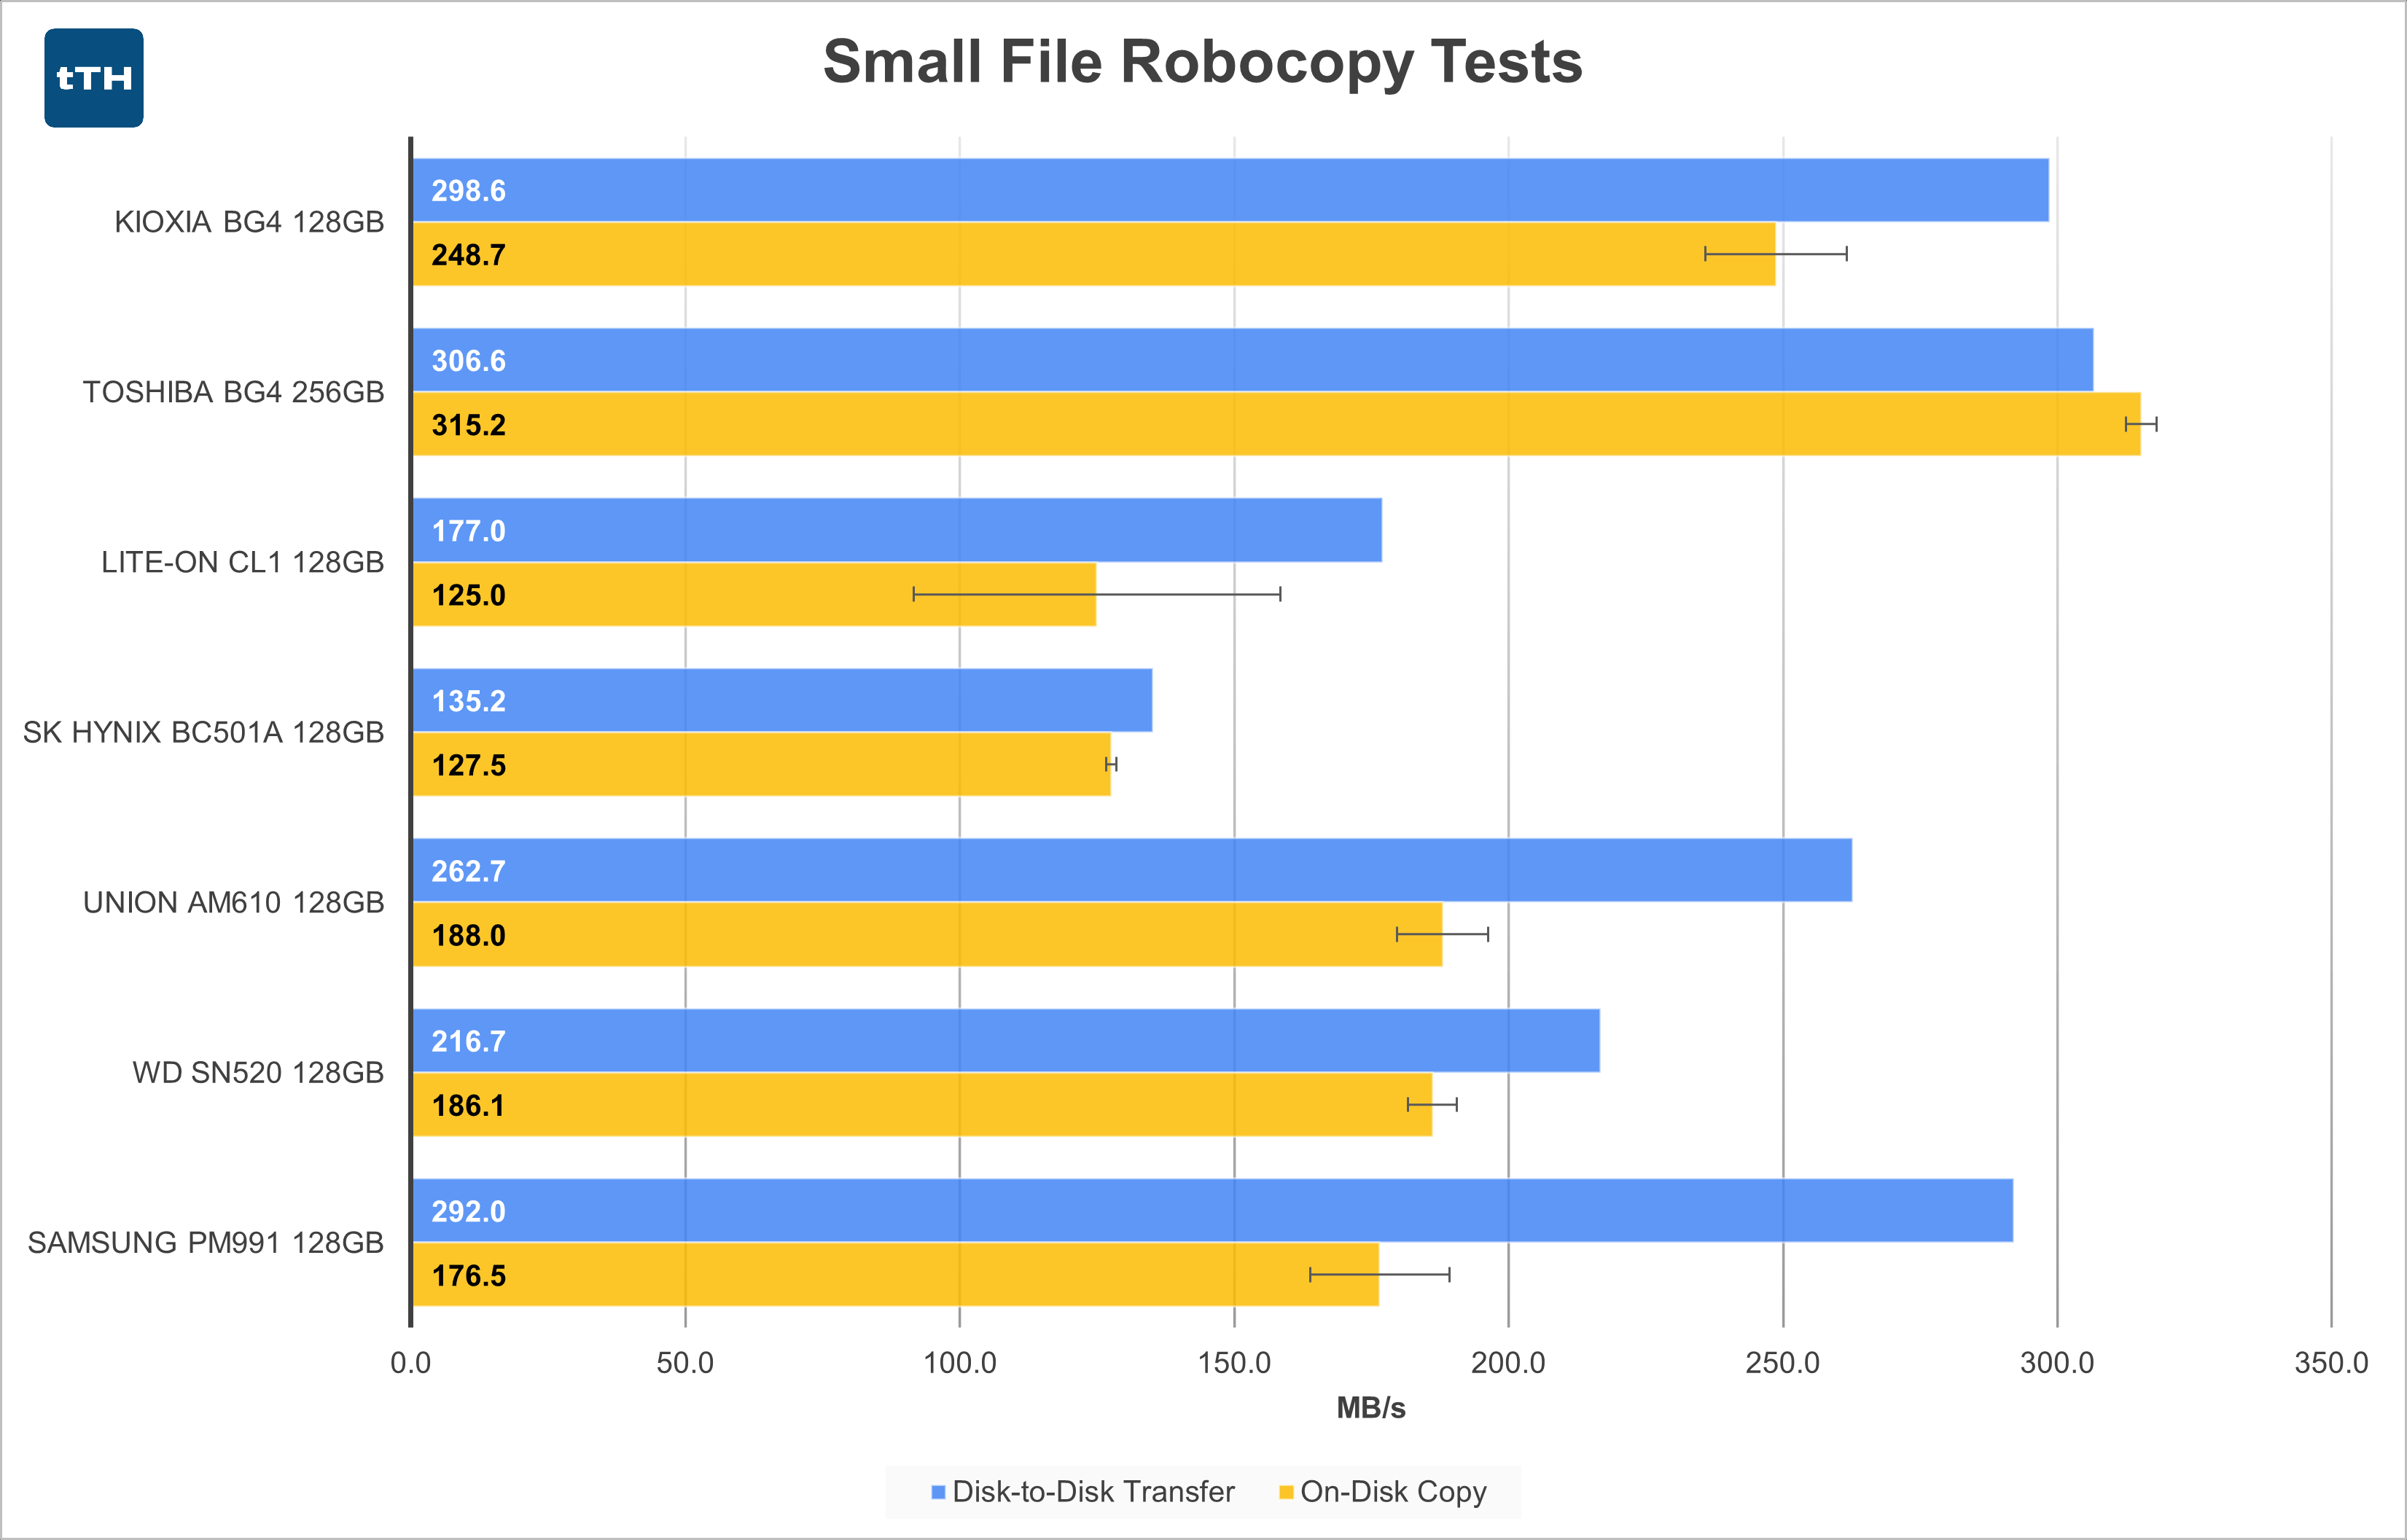 Overall, performance in the Small-File tests is higher than you’d normally expect, given that SSDs tend to perform better with large sequential chunks of data — at least at low queue depths that make up the majority of common consumer workloads. But that can largely be explained away by the fact that there’s also a lot less data involved in this test. Less data means that proportionally more of the test ends up within the drives’ SLC caches.
Disk to disk transfers are still faster than the on-disk copy operations for all the 128GB drives. The 256GB BG4 reverses this trend, likely because its on-disk copy speed was able to exceed the read speed of the BC501A boot drive in the 2.0 x2 slot. The 128GB BG4 performs quite well, as does the PM991. The CL1 and BC501A fall to the back of the pack for both Small File operations. Rankings for Transfer vs On-Disk Copy shuffle around a bit, both within the Small File test as well as compared to the Large File test, but at this point I would say there aren’t any glaring surprises.
Conclusion
There’s a lot of information here to sum up. I have two primary use cases to evaluate for these drives: first as an OS/boot drive, and second in an external USB enclosure to transfer large files from computer to computer.
For either of these scenarios, these drives could be really appealing for someone on a tight budget buying them second hand or by reusing parts that are lying around. This would have certainly been relevant in the early days of COVID when people were rushing to do budget builds when they were suddenly trapped at home looking for a hobby.
For OS/Application duty:
-
Of the 128GB drives, I’d definitely say the BG4 and PM991 seem to come out ahead of the pack. For better or worse, there isn’t one metric that makes these drives stand out like a shining beacon though. Their 4K random reads are a bit ahead of the others, they have great sequential reads and writes, and their SLC caches have a nice balance of size and speed.
-
As is questionably borne out by the PCMark8 results, application performance is probably relatively similar between all the drives. That said, I’d definitely stay away from the BC501A and CL1 if you’re looking for the best performance in this category, as both drives seem to underperform in several of the metrics. There isn’t enough of a price difference between the drives to warrant getting the lower-tier drives unless you just can’t find the others.
-
One of the largest takeaways here is that the spec sheets seem to not matter so much as the manufacturers are likely all using different methods for deriving specifications, though I imagine this won’t be a revelation to anyone already well versed in the SSD industry.
-
Perhaps more interesting is the finding that a drive with a DRAM cache won’t always perform better than a DRAMless model.
For file transfer duty:
-
If an external enclosure for large file transfers is the intended application, I’d definitely lean towards the SN520 and the PM991, as they had the fastest time to fill the drive to 100%. But even this comes with some caveats.
-
To really get the full performance out of these drives, you’ll need an enclosure that delivers at least USB 3.2 Gen 2 x1 (10Gb/s) speeds for writes and either USB 3.2 Gen 2 x2 or Thunderbolt 3 (x4 lanes) for peak reads. Enclosures with these specifications are not nearly as mainstream as USB to SATA adapters are (or even were several years ago) despite the fact that M.2 PCIe SSDs have been around since 2014 when Samsung released the XP941.
-
Many of the inexpensive enclosures you can find are from no-name vendors with spotty performance or reliability, and most of the rest are simply expensive. StarTech’s 10Gbps enclosure looks to retail for around $60. You can buy a decent DRIVE for that kind of money, and notably that is 2-3x the cost of any of these low-capacity, pint-sized drives. Plenty of other external SSDs with fast interfaces are sold, but many of these come with slower TLC or even QLC drives whose sustained write performance will leave much to be desired.
-
In a sustained write workload, these drives tend to get hot, so thermal design of the enclosure becomes important as hot drives can throttle and lower the performance of what would otherwise be a fast drive. I don’t currently have an objective, quantitative way of logging temperatures during a test run, but it is a measurement I’m interested in capturing.
-
Even if you already had a high performance enclosure on-hand, the drive-fill numbers for these low-end PCIe drives is just not that compelling. The fastest 128GB drive in this roundup only managed 242MB/s on average. Even a modest SATA SSD or more capable PCIe M.2 drive will likely be able to maintain significantly higher speeds. I intend to explore this in a follow-up article.