Traditional Hard Drives - Perspective for the Proliferation of SSDs
Comparing the performance of some conventional spinning hard drives against SSDs.
In this post I’ll be adding even more performance perspective by running a couple spinning hard drives through the same test suite as I run on SSDs.
Intro
For decades before Solid State Drives were invented, spinning hard drives were the storage medium of choice. I’ll refer to these as just HDDs throughout the article, though technically, SSDs are just another type of hard drive, saying “spinning hard drives” over and over is going to get monotonous. Due to their mechanical nature they were slow, fragile, susceptible to failure, power hungry, bulky. The list probably goes on. SSDs solve many of these issues all at once while bringing some (but few) tradeoffs to the table. The main reason to be buying a mechanical disk these days is for storing lots of data. Traditional disks still have a substantial price per GB advantage over SSDs, particularly when it comes to larger drives. At least in the consumer space you can also get HDDs with many times the capacity of even the largest SSDs, though this is starting to change. Still, most consumers just don’t need that much storage capacity leading to traditional HDDs to be thought of as archaic. Since they’re also made mostly of metal, this has lead to the somewhat tongue in cheek nickname of “Spinning Rust”.
In this article I’m going to run a couple of spinning disks through the same test suite that I’ve been using on the SSDs to illustrate how SSDs provide significantly higher performance in storage tasks.
Before I get too far, if you want to know more about how I perform the tests in this review, check out my first blog post: SSD Review Background, Setup, and Methodology v1.0. My first round of reviews will all use the same Testbed and Methodology, so will be directly comparable.
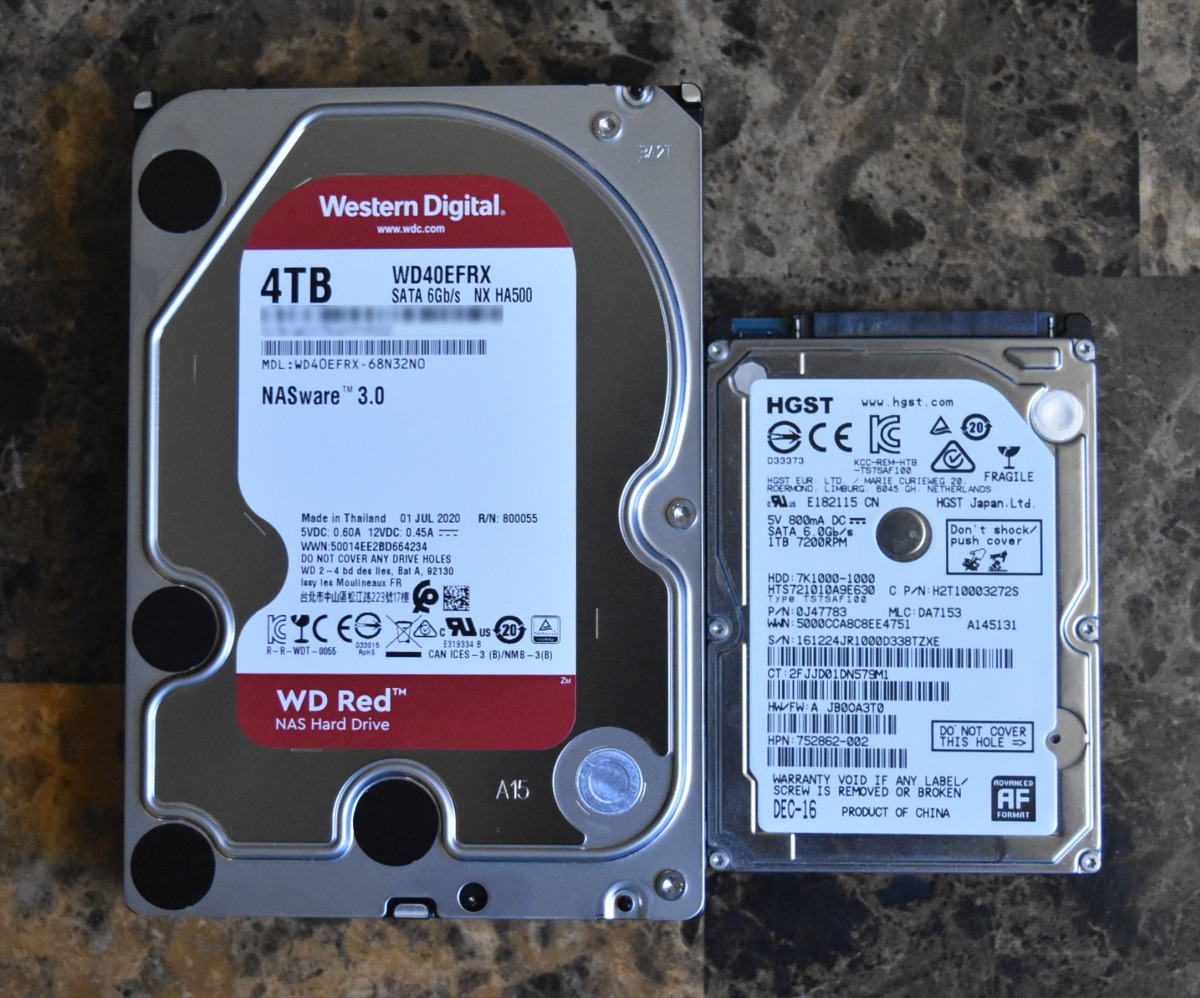
The Drives:
| The Drives - Table of Specifications | ||
|---|---|---|
| Hitachi 1TB | Western Digital Red 4TB | |
| Model Number | 7K1000-1000 | WD40EFRX |
| Formfactor | 2.5in | 3.5in |
| Capacity | 1000GB | 4000GB |
| Interface | SATA III | SATA III |
| Spindle Speed | 7200RPM | 5400RPM |
| Cache | 32MB | 64MB |
| Retail/OEM Drive | OEM | Retail |
| Cost Today | $105 |
HGST 7K1000 1TB
The HGST 7K1000 is a 2.5” 7200RPM SATA Hard Drive. This is the faster of the two common, consumer hard drive rotational speeds. Higher spindle speeds lead to faster sequential reads since the head passes over more sectors of the disk when the disk is spinning more quickly. It also increases the speed of random accesses since, on average, the head will take less time to pass over the correct data as it seeks across the platter. That said, since 2.5” drives have significantly smaller physical disks than 3.5” drives, the total linear velocity of the heads over the plater ends up being lower. As such, despite the higher rotation rate a 2.5” drive will provide lower sequential performance than a similar 3.5” drive, all things (such as data density on the platter) being equal. This particular drive was pulled from a laptop where it was replaced with an SSD.
Western Digital Red 4TB
Western Digital (WD) has several lines of traditional HDDs. Their Red line is aimed at consumer NASes or other storage (as opposed to application or OS) uses. The drives are supposed to have better reliability than standard Blue or Black series drives due to better vibration tolerances when many drives are in an enclosure together and also have better error recovery behavior intended to keep the drives from falling out of a RAID array when errors occur. In 2020 WD faced some controversy when they began replacing their conventional magnetic recording (CMR) drives with slower but higher platter density shingled magnetic recording (SMR) disks. SMR disks have worse write behavior in a number of conditions which can lead to poor performance in RAID arrays or ZFS pools. This caused drives to have unexpectedly poor write performance and caused drives to spend so long writing some data that the storage controller would think the drive had become unresponsive and would remove it from the array or pool, potentially causing a rebuild or even data loss.
This particular drive is an EFRX drive, which uses the traditionally higher performing CMR technology.
Review
To keep the graphs from getting too cluttered, I’ve used the 128GB Kioxia BG4 as a representative of the low-end/low-capacity NVMe drives from the first roundup and have kept the 1024GB XG6 as an example of a moderately high performance NVMe drive. I’m also including the 128GB PM871b to represent low-end SATA SSDs and the 1TB 860 EVO to represent high-performance SATA SSDs. More details on each of these drives can be found in their respective reviews.
In case you didn’t catch my note at the top, if you’d like to know more about my hardware setup as well as my testing methodology, check out my SSD Review Background, Setup, and Methodology v1.0 piece.
Write Test — Disk Fill Summary
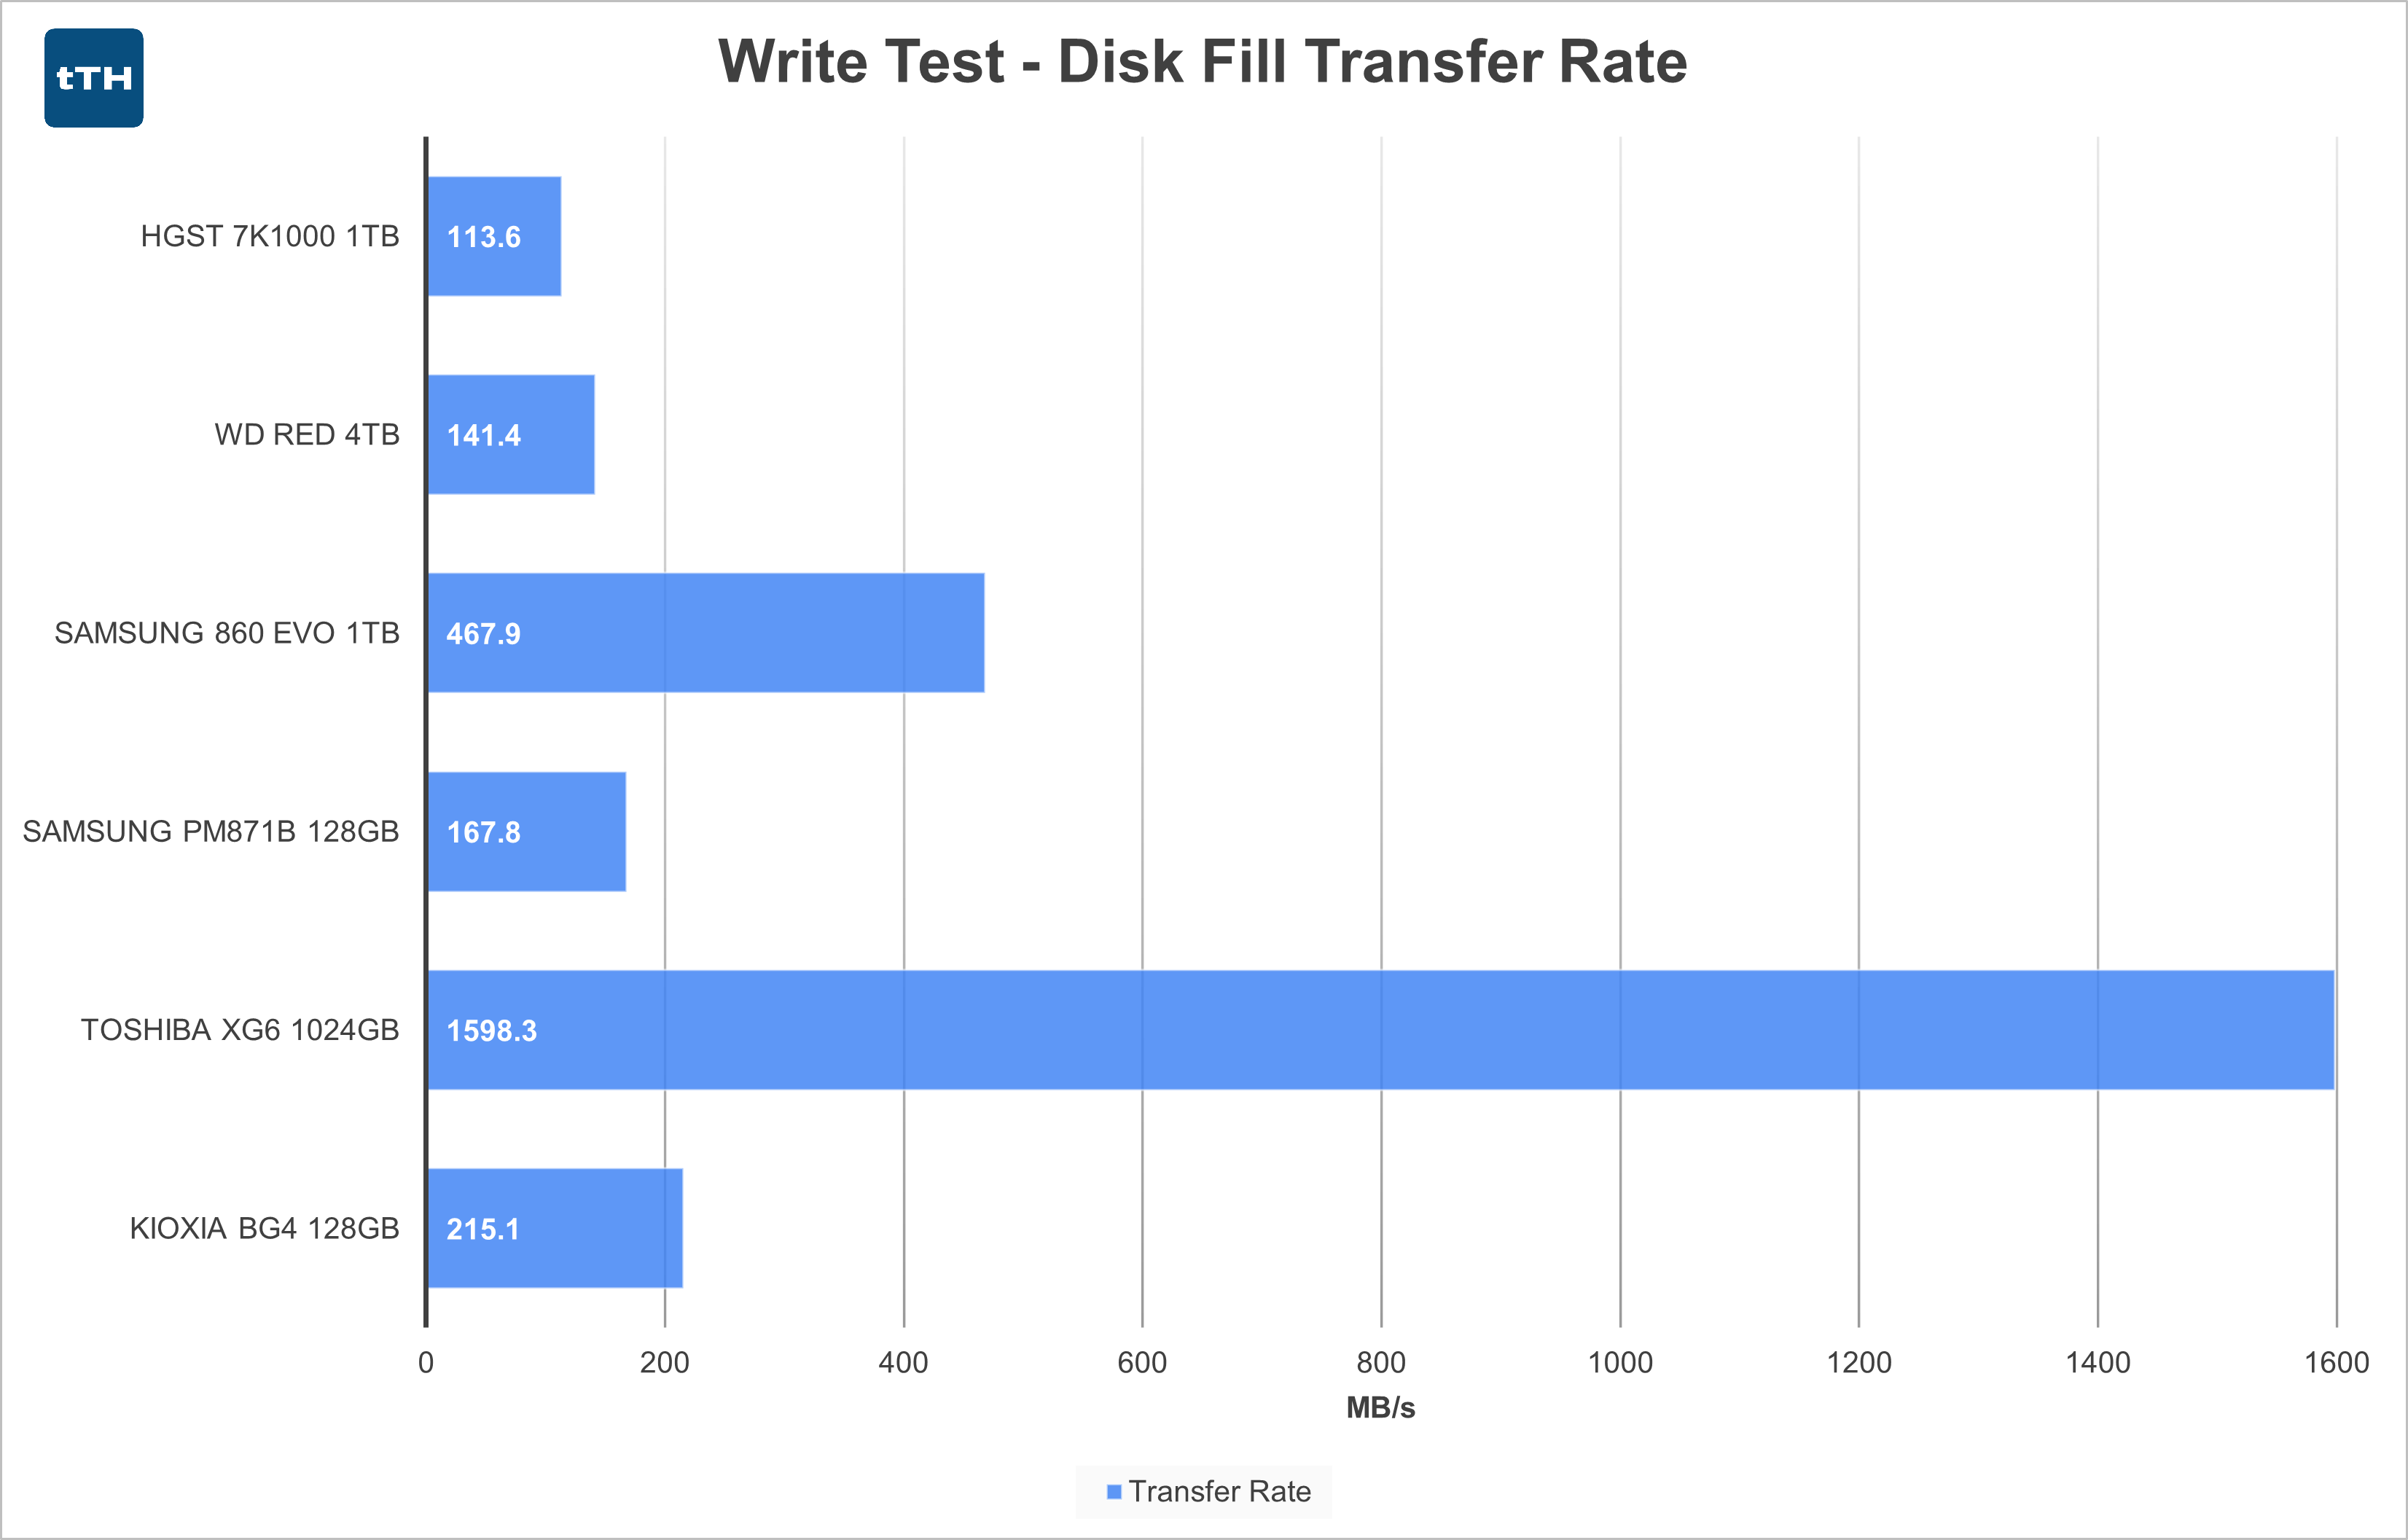
 Right off the bat, the Disk Fill Transfer Rate test doesn’t look too bad against the low-end SSDs, even the NVMe drive. Admittedly, this is one of the weaker aspects of performance on the low-capacity and low-performance drives. The spinning disk drives are the slowest in the group, though by not a large amount.
The higher performing SATA and PCIe SSDs outperform the HDDs by significant margins, approximately 3x and 11x compared to the faster Red 4TB.
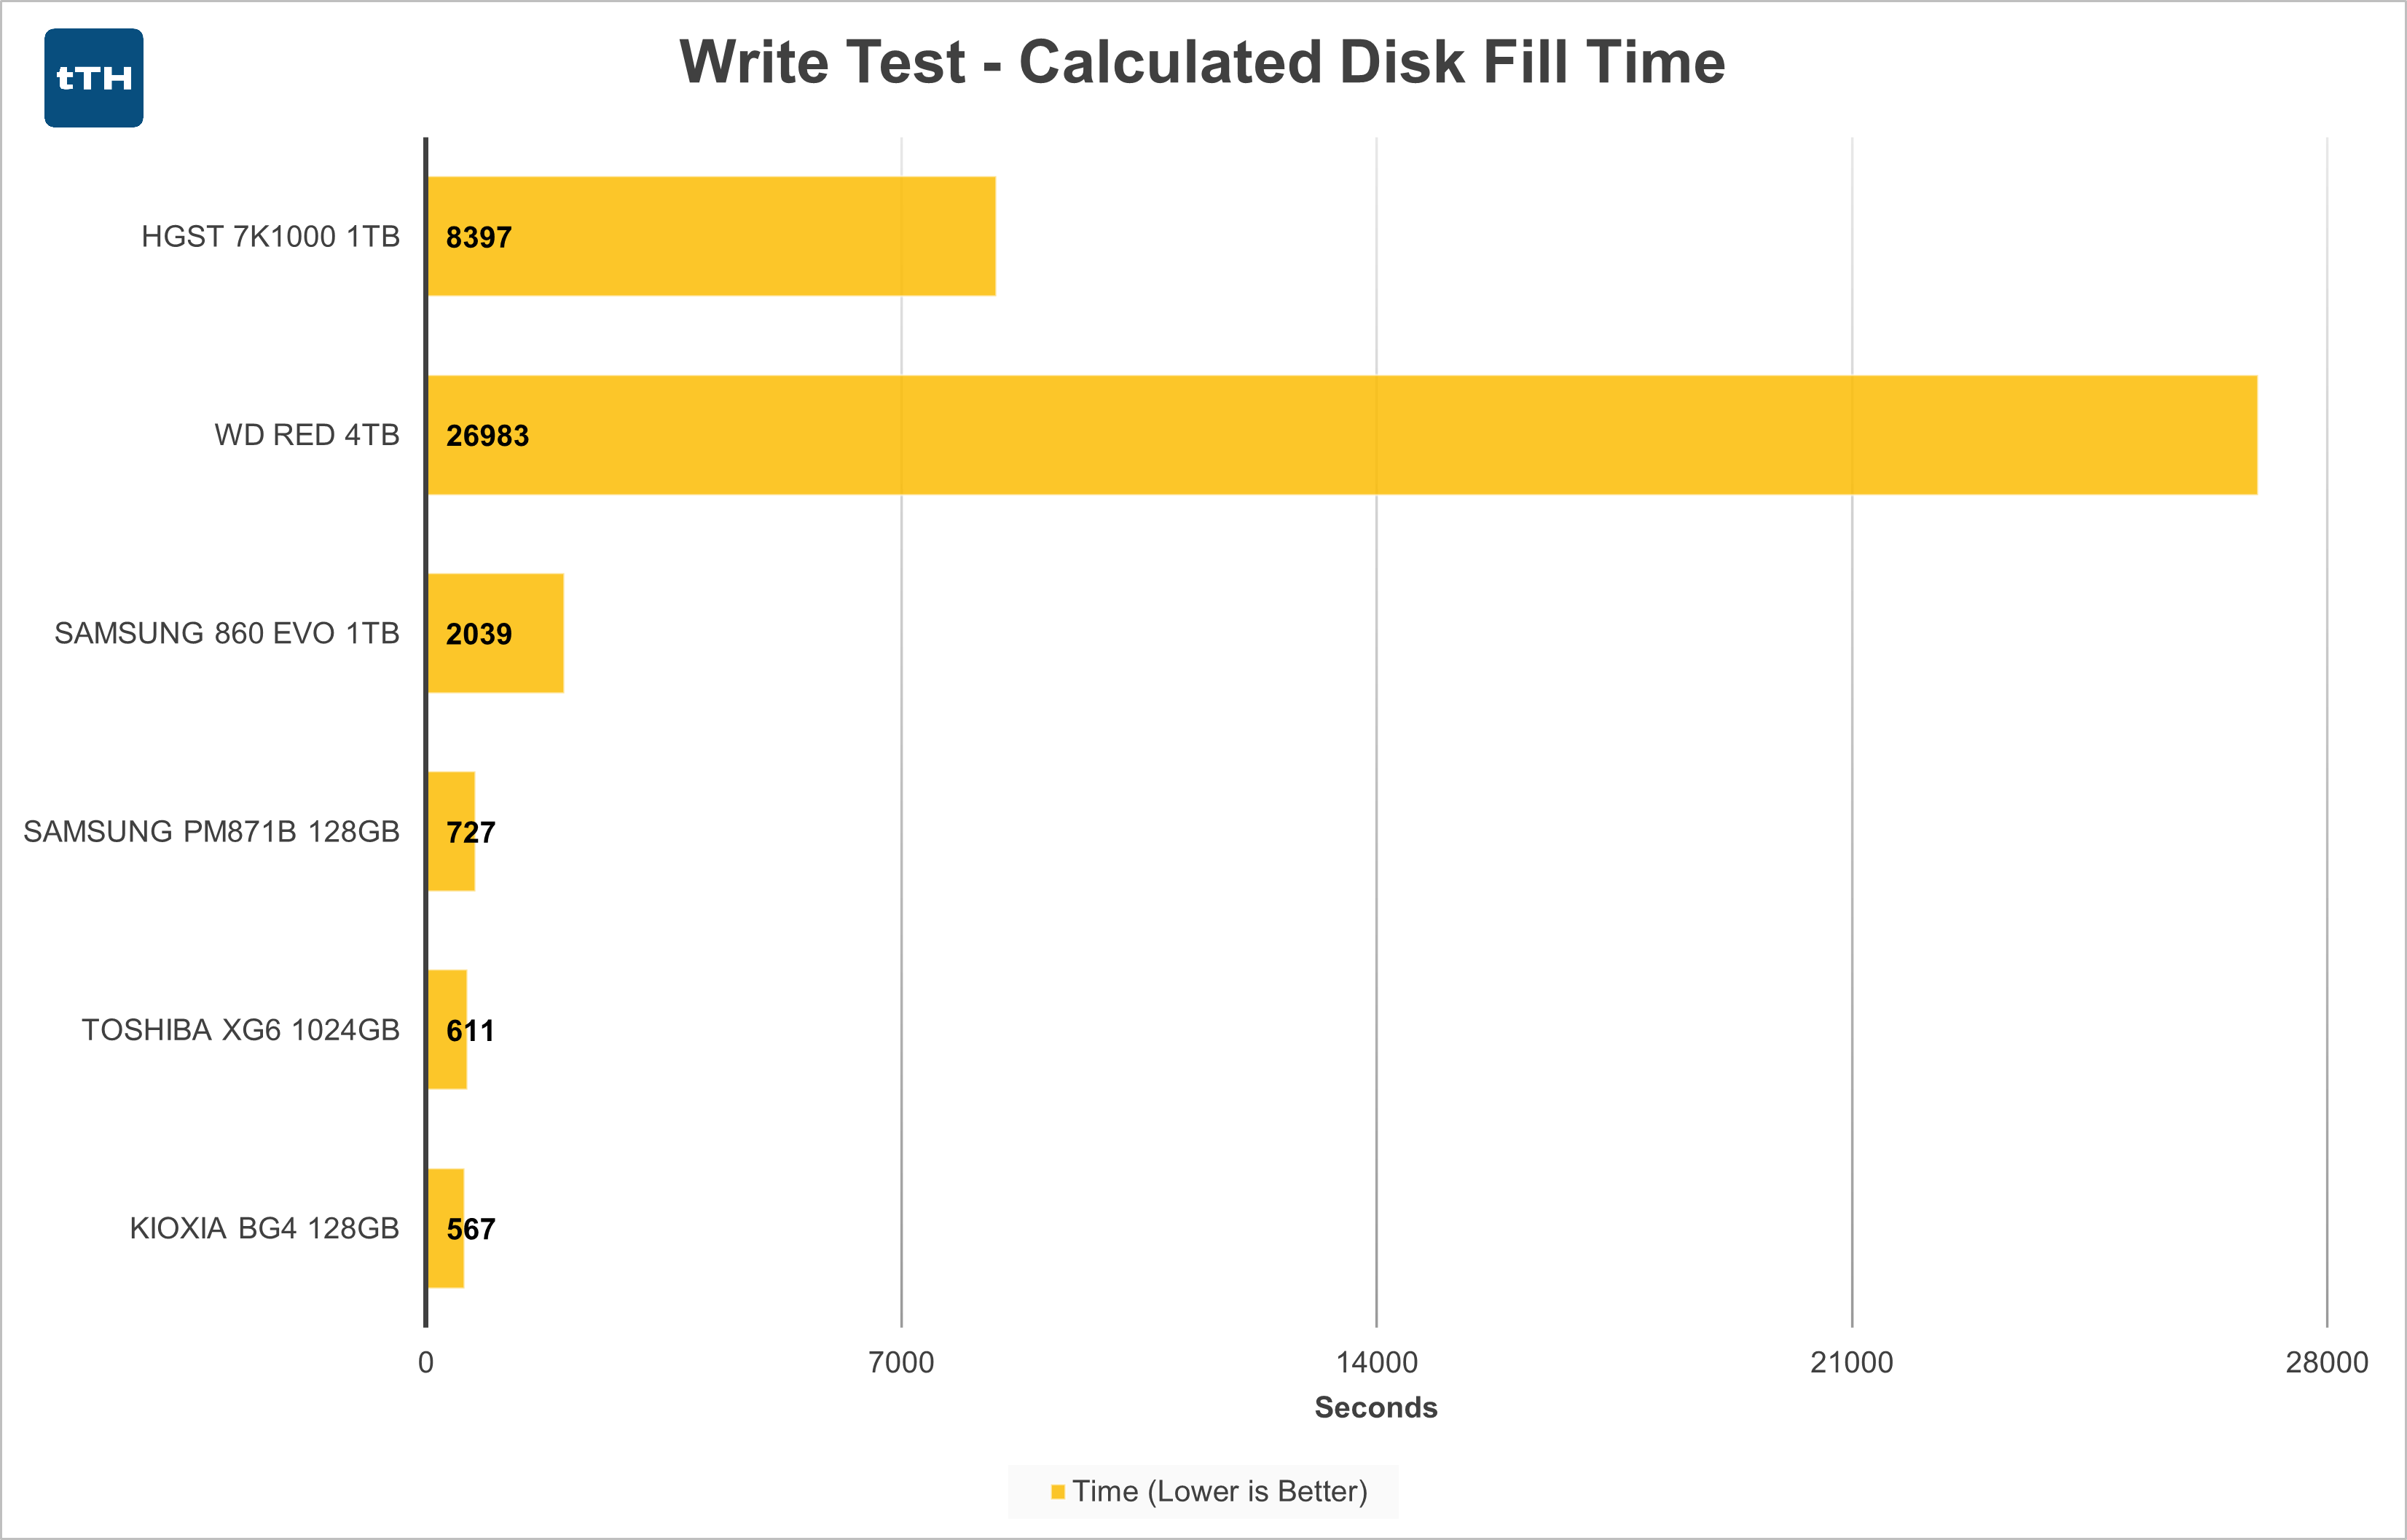
Things turn around when we look at Calculated Disk Fill Time. Since these HDDs have several times the capacity of similarly performing SSDs, they end up taking many times longer to fill.
Interestingly, even under the best of circumstances, neither drive is coming anywhere near saturating its SATA III bus.
Write Test — Disk Fill
HGST 7K1000 1TB
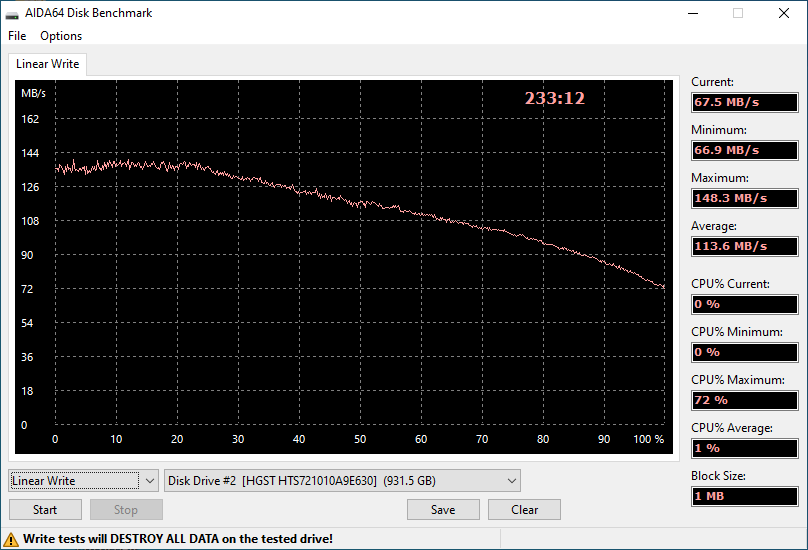 The HGST starts the write test around 140MB/s, with at least one non-visible data point peaking at 148.3MB/s performance and then slowly decreasing to 66.9MB/s. The performance curve looks a bit outside of what I would have expected with the initial performance appearing relatively flat before beginning the downward trend. As there have likely only been incremental updates to 2.5” HDDs, it is likely that this performance is a relatively close proxy for how current 1TB 7200RPM 2.5” drives perform.
Spinning disks’ first sectors are on the outer edge of the platter, meaning that at a fixed RPM the linear velocity over the media is the highest at the outer edge of the platter. As the drive is filled, write speeds degrade at a relatively linear rate until they bottom out at the inner-most edge of the disk.
WD Red 4TB
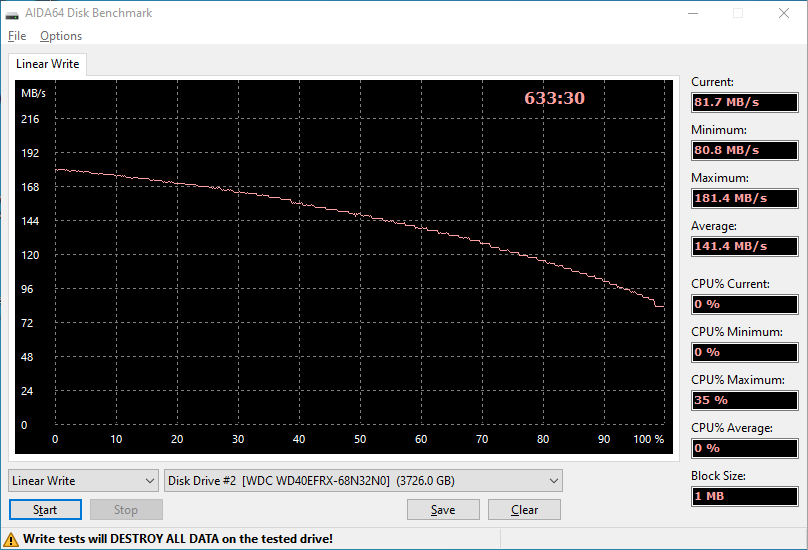 The WD Red drive’s performance curve more closely resembles what I’d expect for how performance linearly decreases over the capacity of the drive. Speed at the beginning of the drive is a relatively impressive 181.4MB/s and ends at 80.8MB/s. Despite the handicap of spinning at 5400RPM, the 3.5” WD Red still outperforms the faster spinning but smaller-diameter HGST drive. The WD drive is also newer than the HGST drive, and likely has higher data density, further increasing performance of the larger drive. Linear write performance of a 7200RPM 3.5” drive should be approximately 33% higher than that of a 5400RPM drive, so an otherwise identical 7200RPM drive would achieve peak performance of approximately 240MB.
Spinning disks’ first sectors are on the outer edge of the platter, meaning that at a fixed RPM the linear velocity over the media is the highest at the outer edge of the platter. As the drive is filled, write speeds degrade at a relatively linear rate until they bottom out at the inner-most edge of the disk.
AS-SSD Sequential Tests
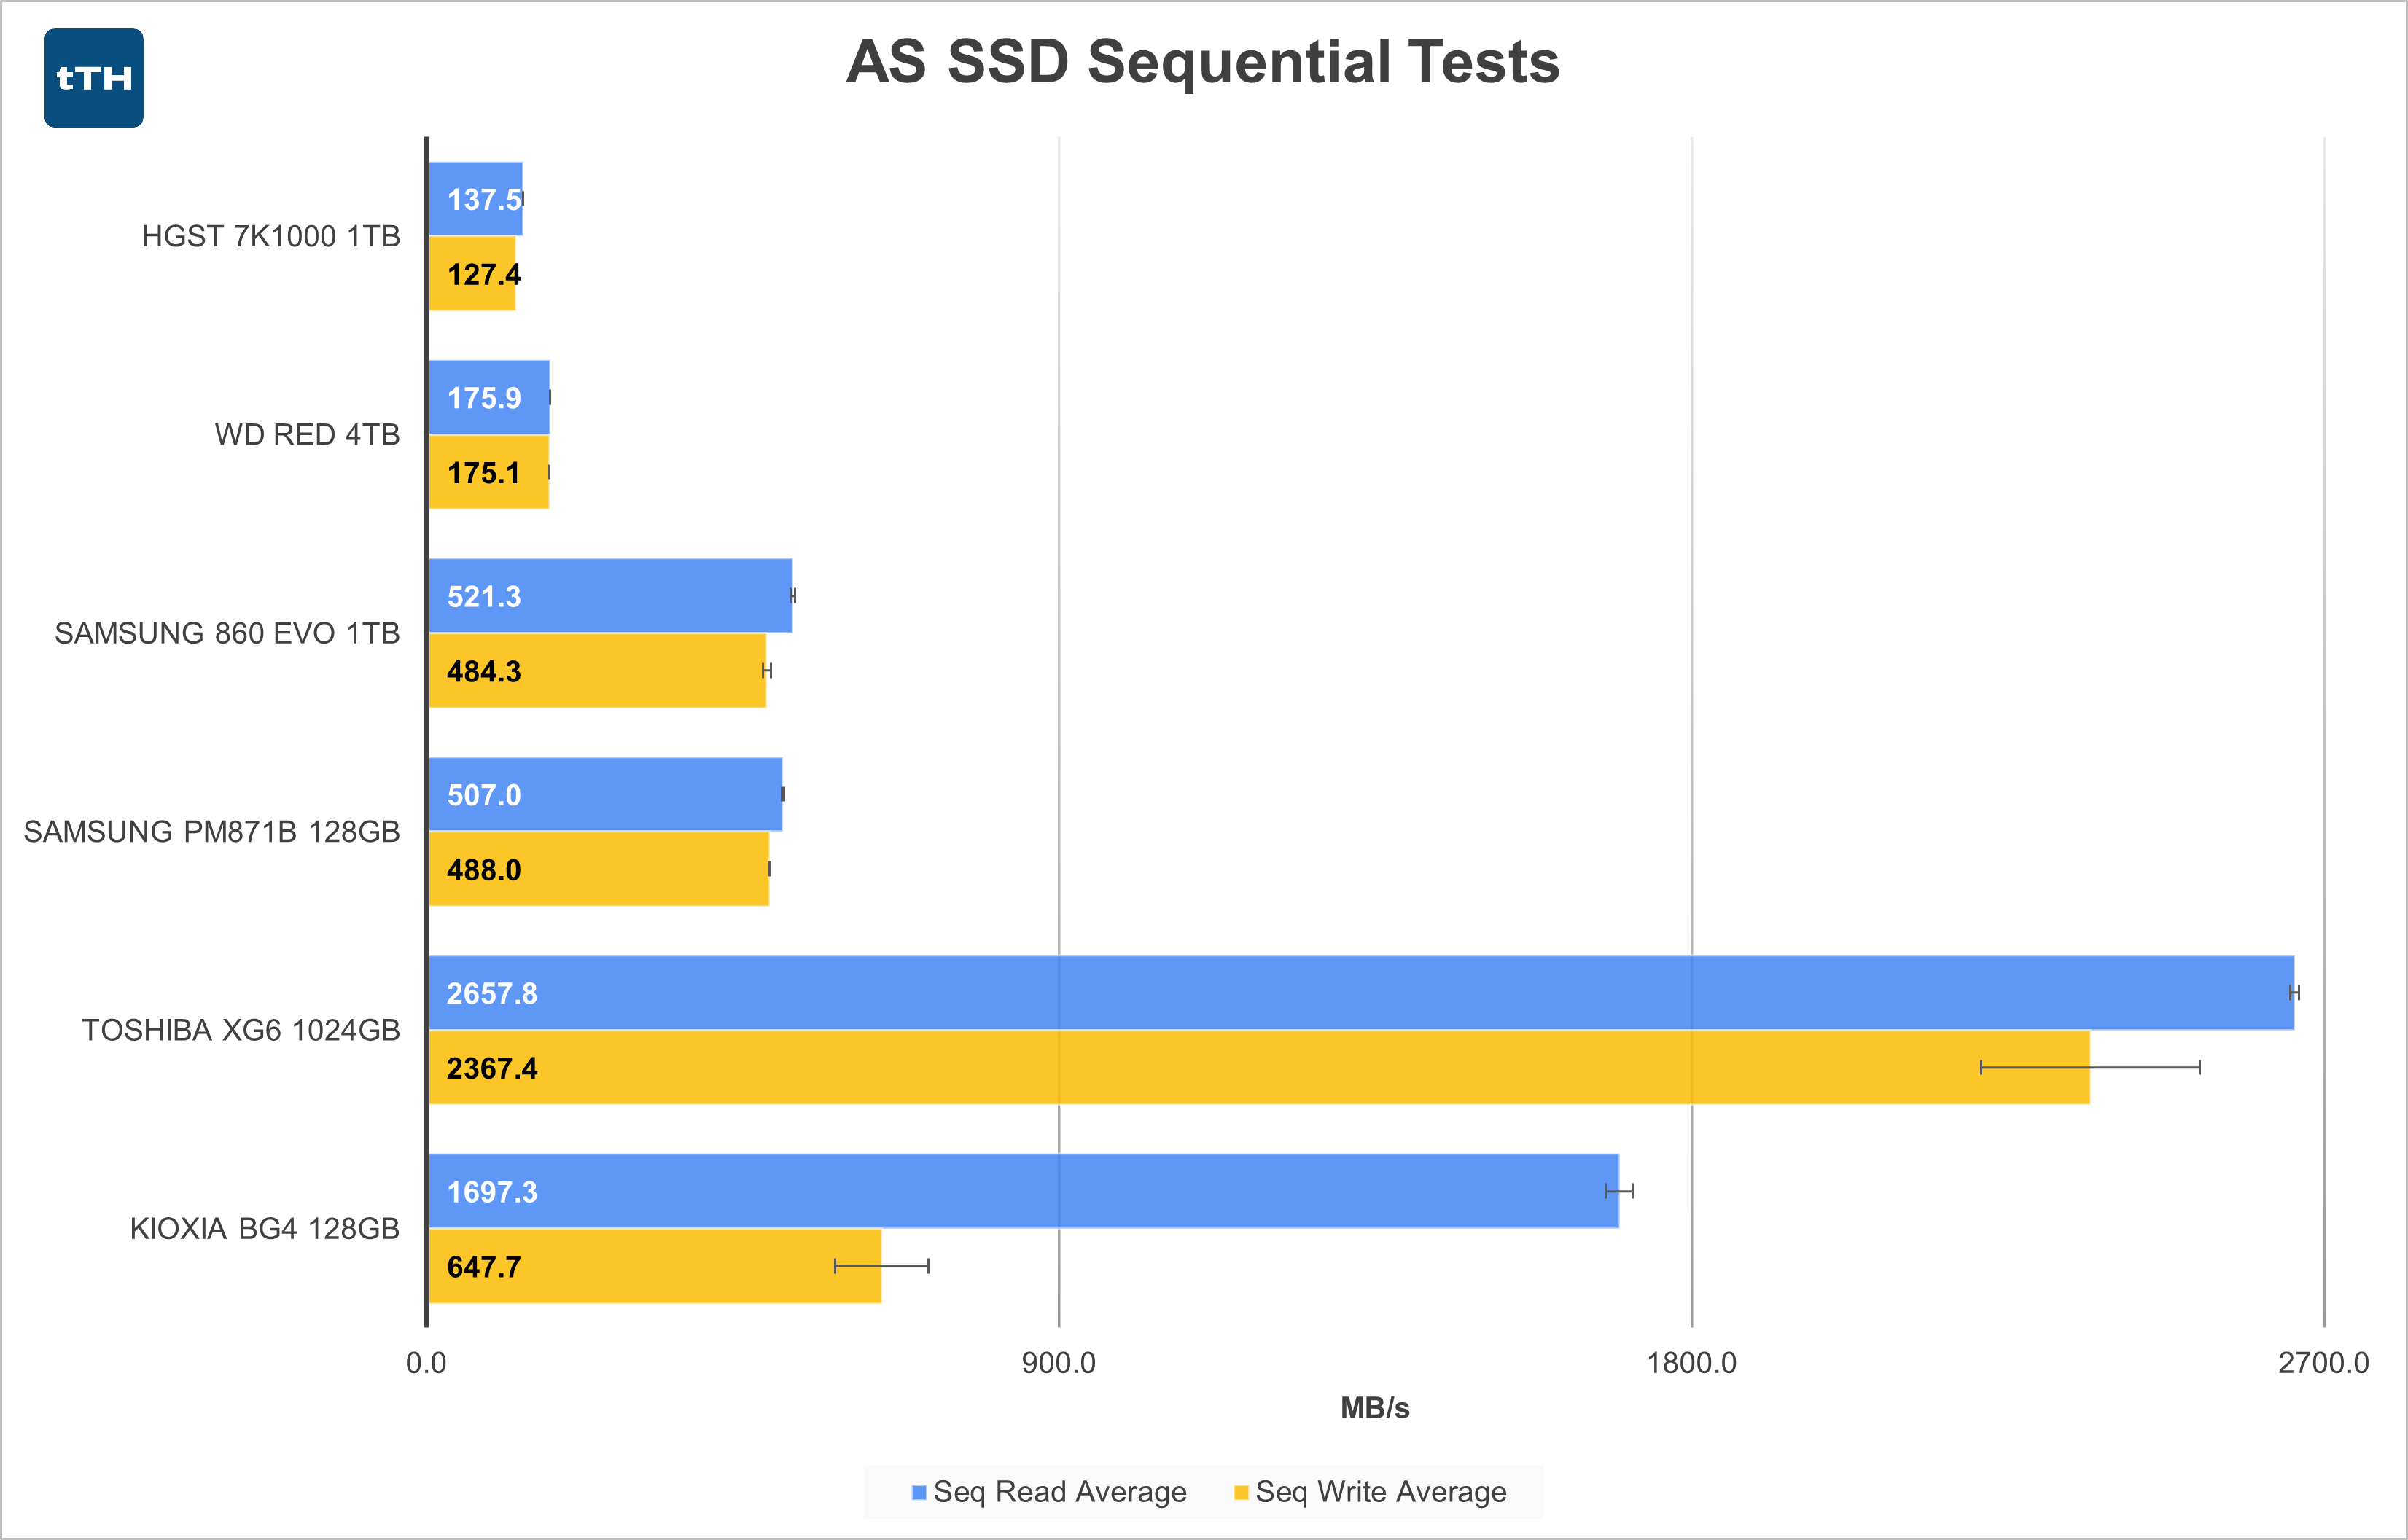 As performed, this test is only writing and then reading back 1GB of data, so we’re seeing the performance of these disks at the outer edge of the platters where the spinning disk drives have the highest performance. The SSDs, which rely on faster SLC caching for small amounts of data, which also place them in the best light.
The SATA SSDs are nearly 3x faster than the WD Red on reads and writes and the XG6 is over 15x faster in reads and 13.5x faster in writes. When moving around large amounts of data, all of the SSDs provide shorter wait times for transfers compared to the HDDs.
AS-SSD 4K Tests
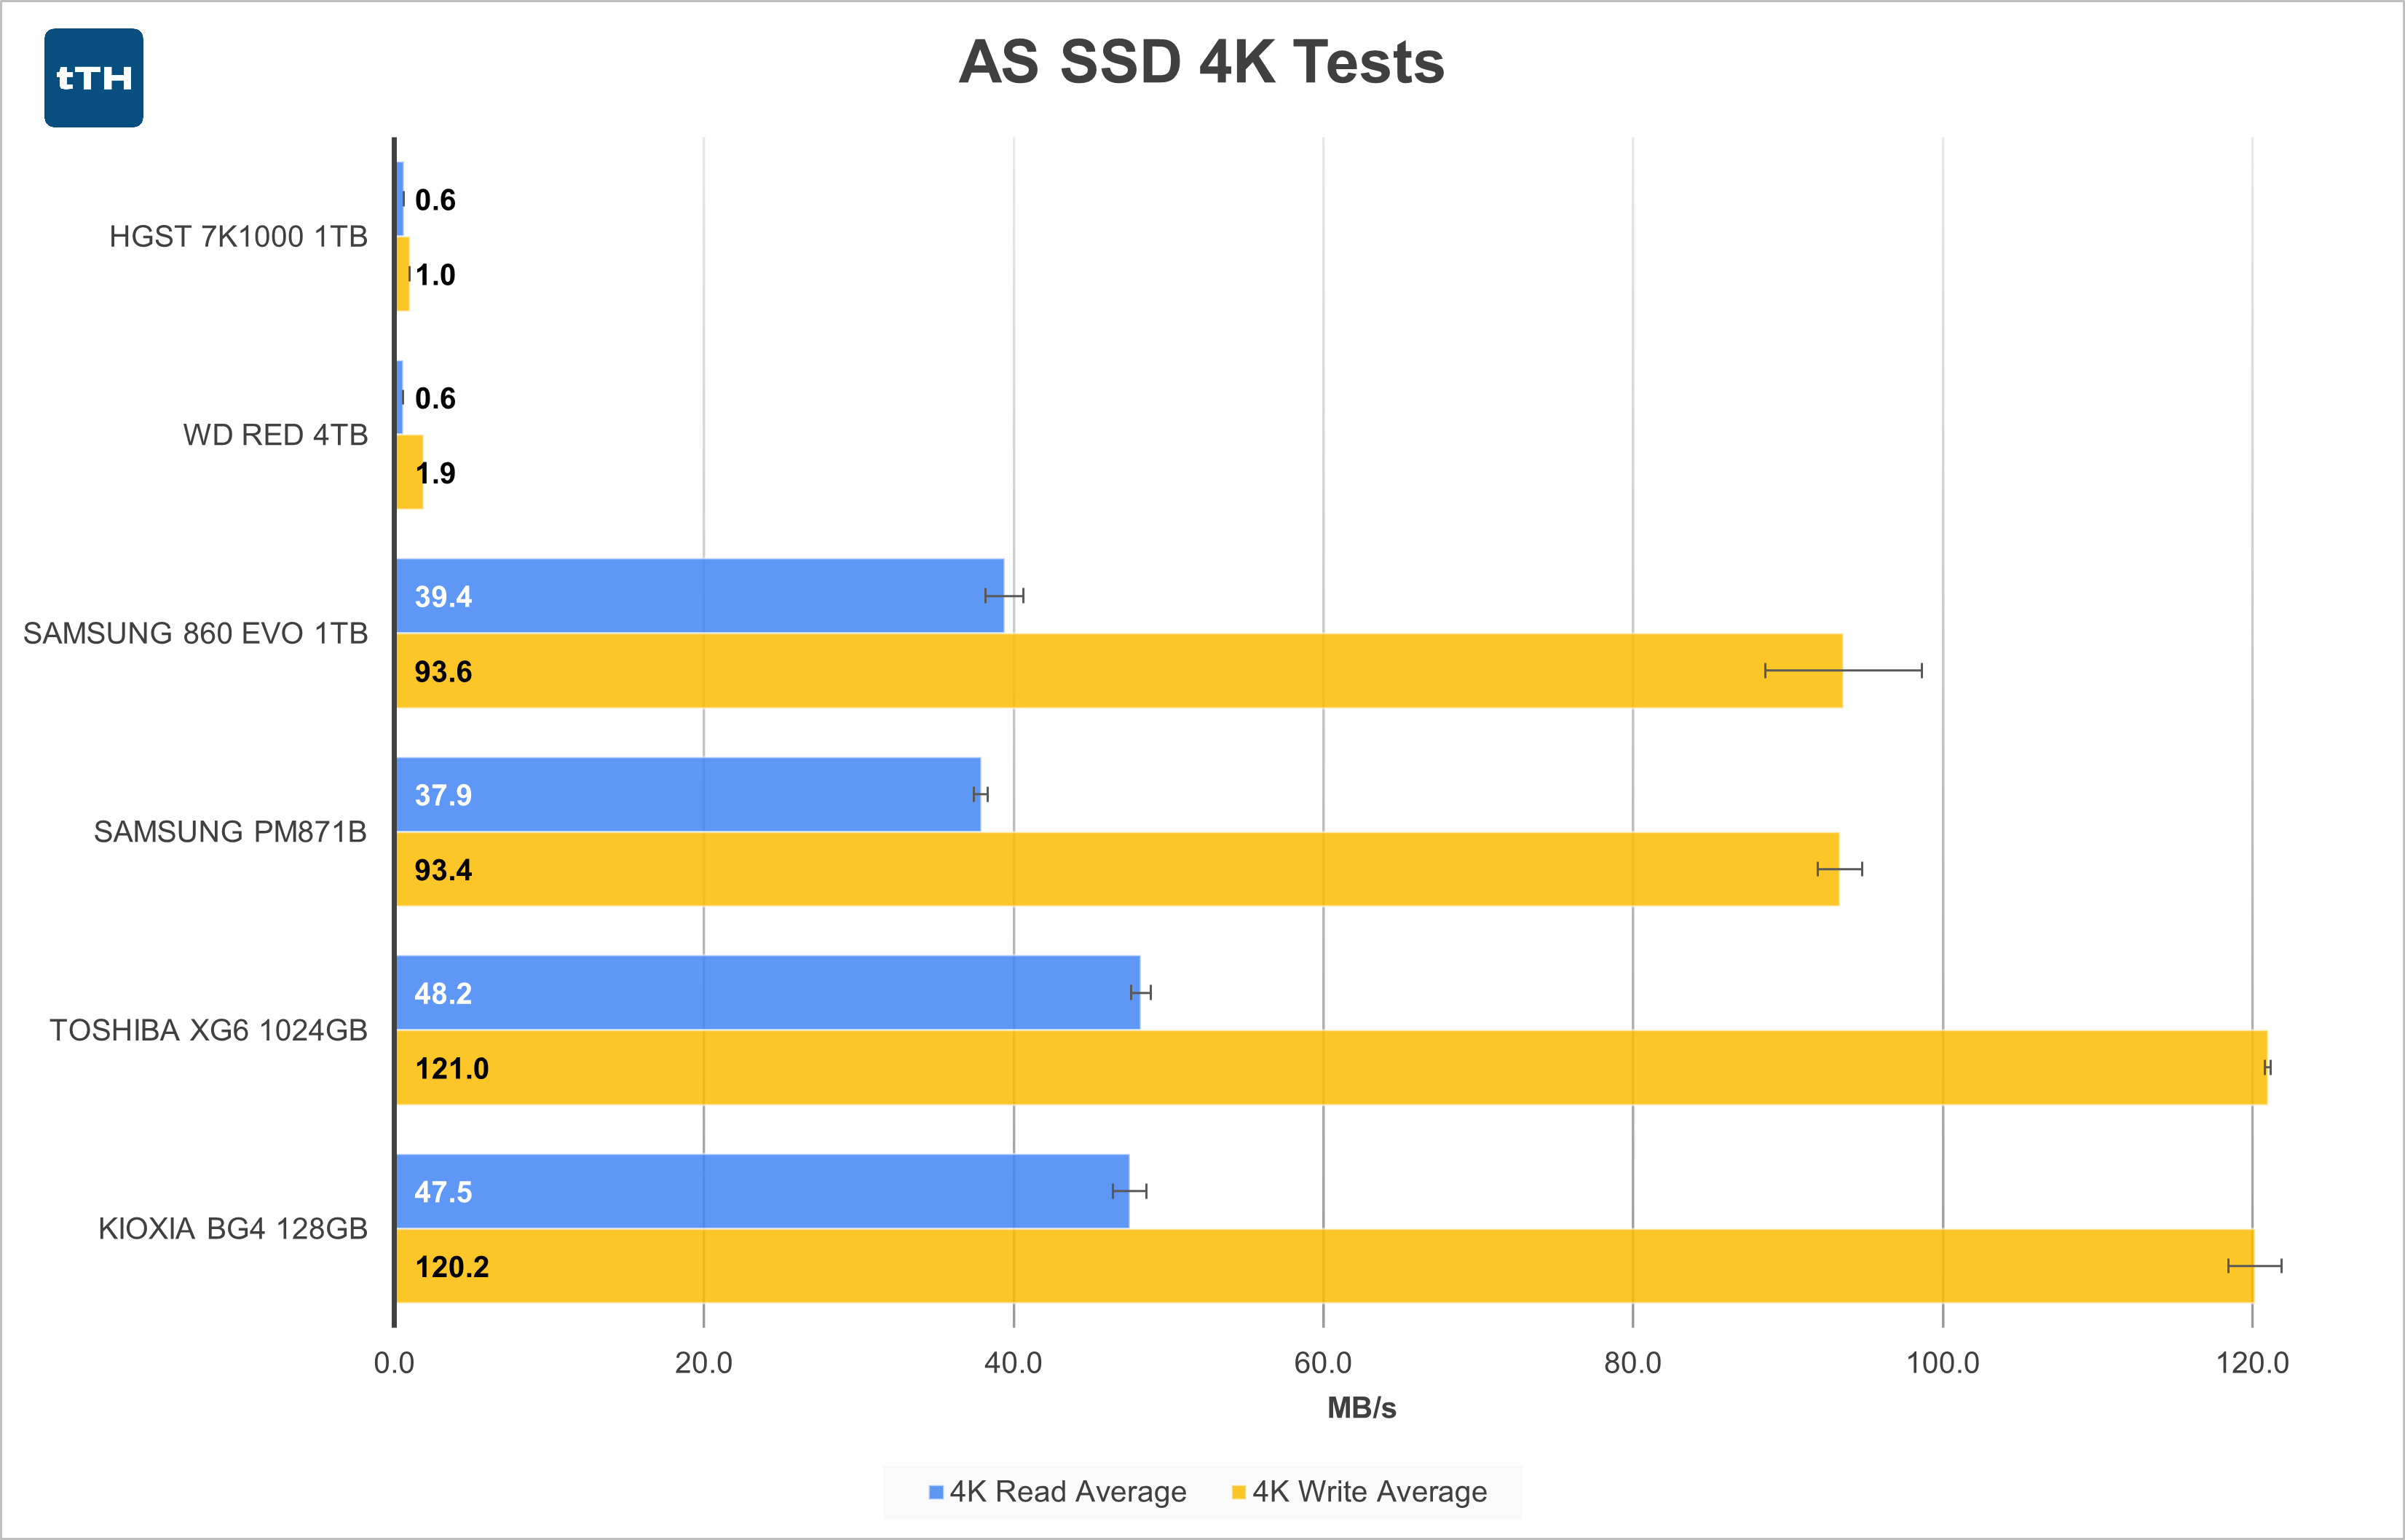 4K Random I/O is where the performance of HDDs really pales in comparison to that of SSDs. Due to their mechanical nature, to perform random operations the heads must be repeatedly actuated back and forth across the radius of the platter(s) while also having to wait for the correct sectors to pass under the the head before again being repositioned. This rapid head actuation is the activity that is generally the cause of a hard drive sounding like it is griding. 4K Random I/O is also moderately important for application performance where an application may need to read or write small amounts of data scattered all over the disk - as opposed to a more linear action like playing back or importing a video file.
This test is actually where I was expecting to see the HGST drive take the lead against the WD Red. The higher spindle speed and smaller platter area should have theoretically lead to faster seek times, but other factors such as how aggressively the heads actuate might have lead to the laptop drive continuing to deliver lower performance.
In 4K reads, both drives round up to a mere 0.6MB/s. This makes the SSDs between 63x and 79x faster than the spinning disks.
In 4K writes, both drives perform slightly better, but the range is still only 1.0MB/s to 1.9MB/s. Despite the faster performance, the SSDs also perform better in this metric leading to the SSDs delivering performance between 49x and 64x higher than the slightly faster WD Red.
PCMark 8 Storage Test
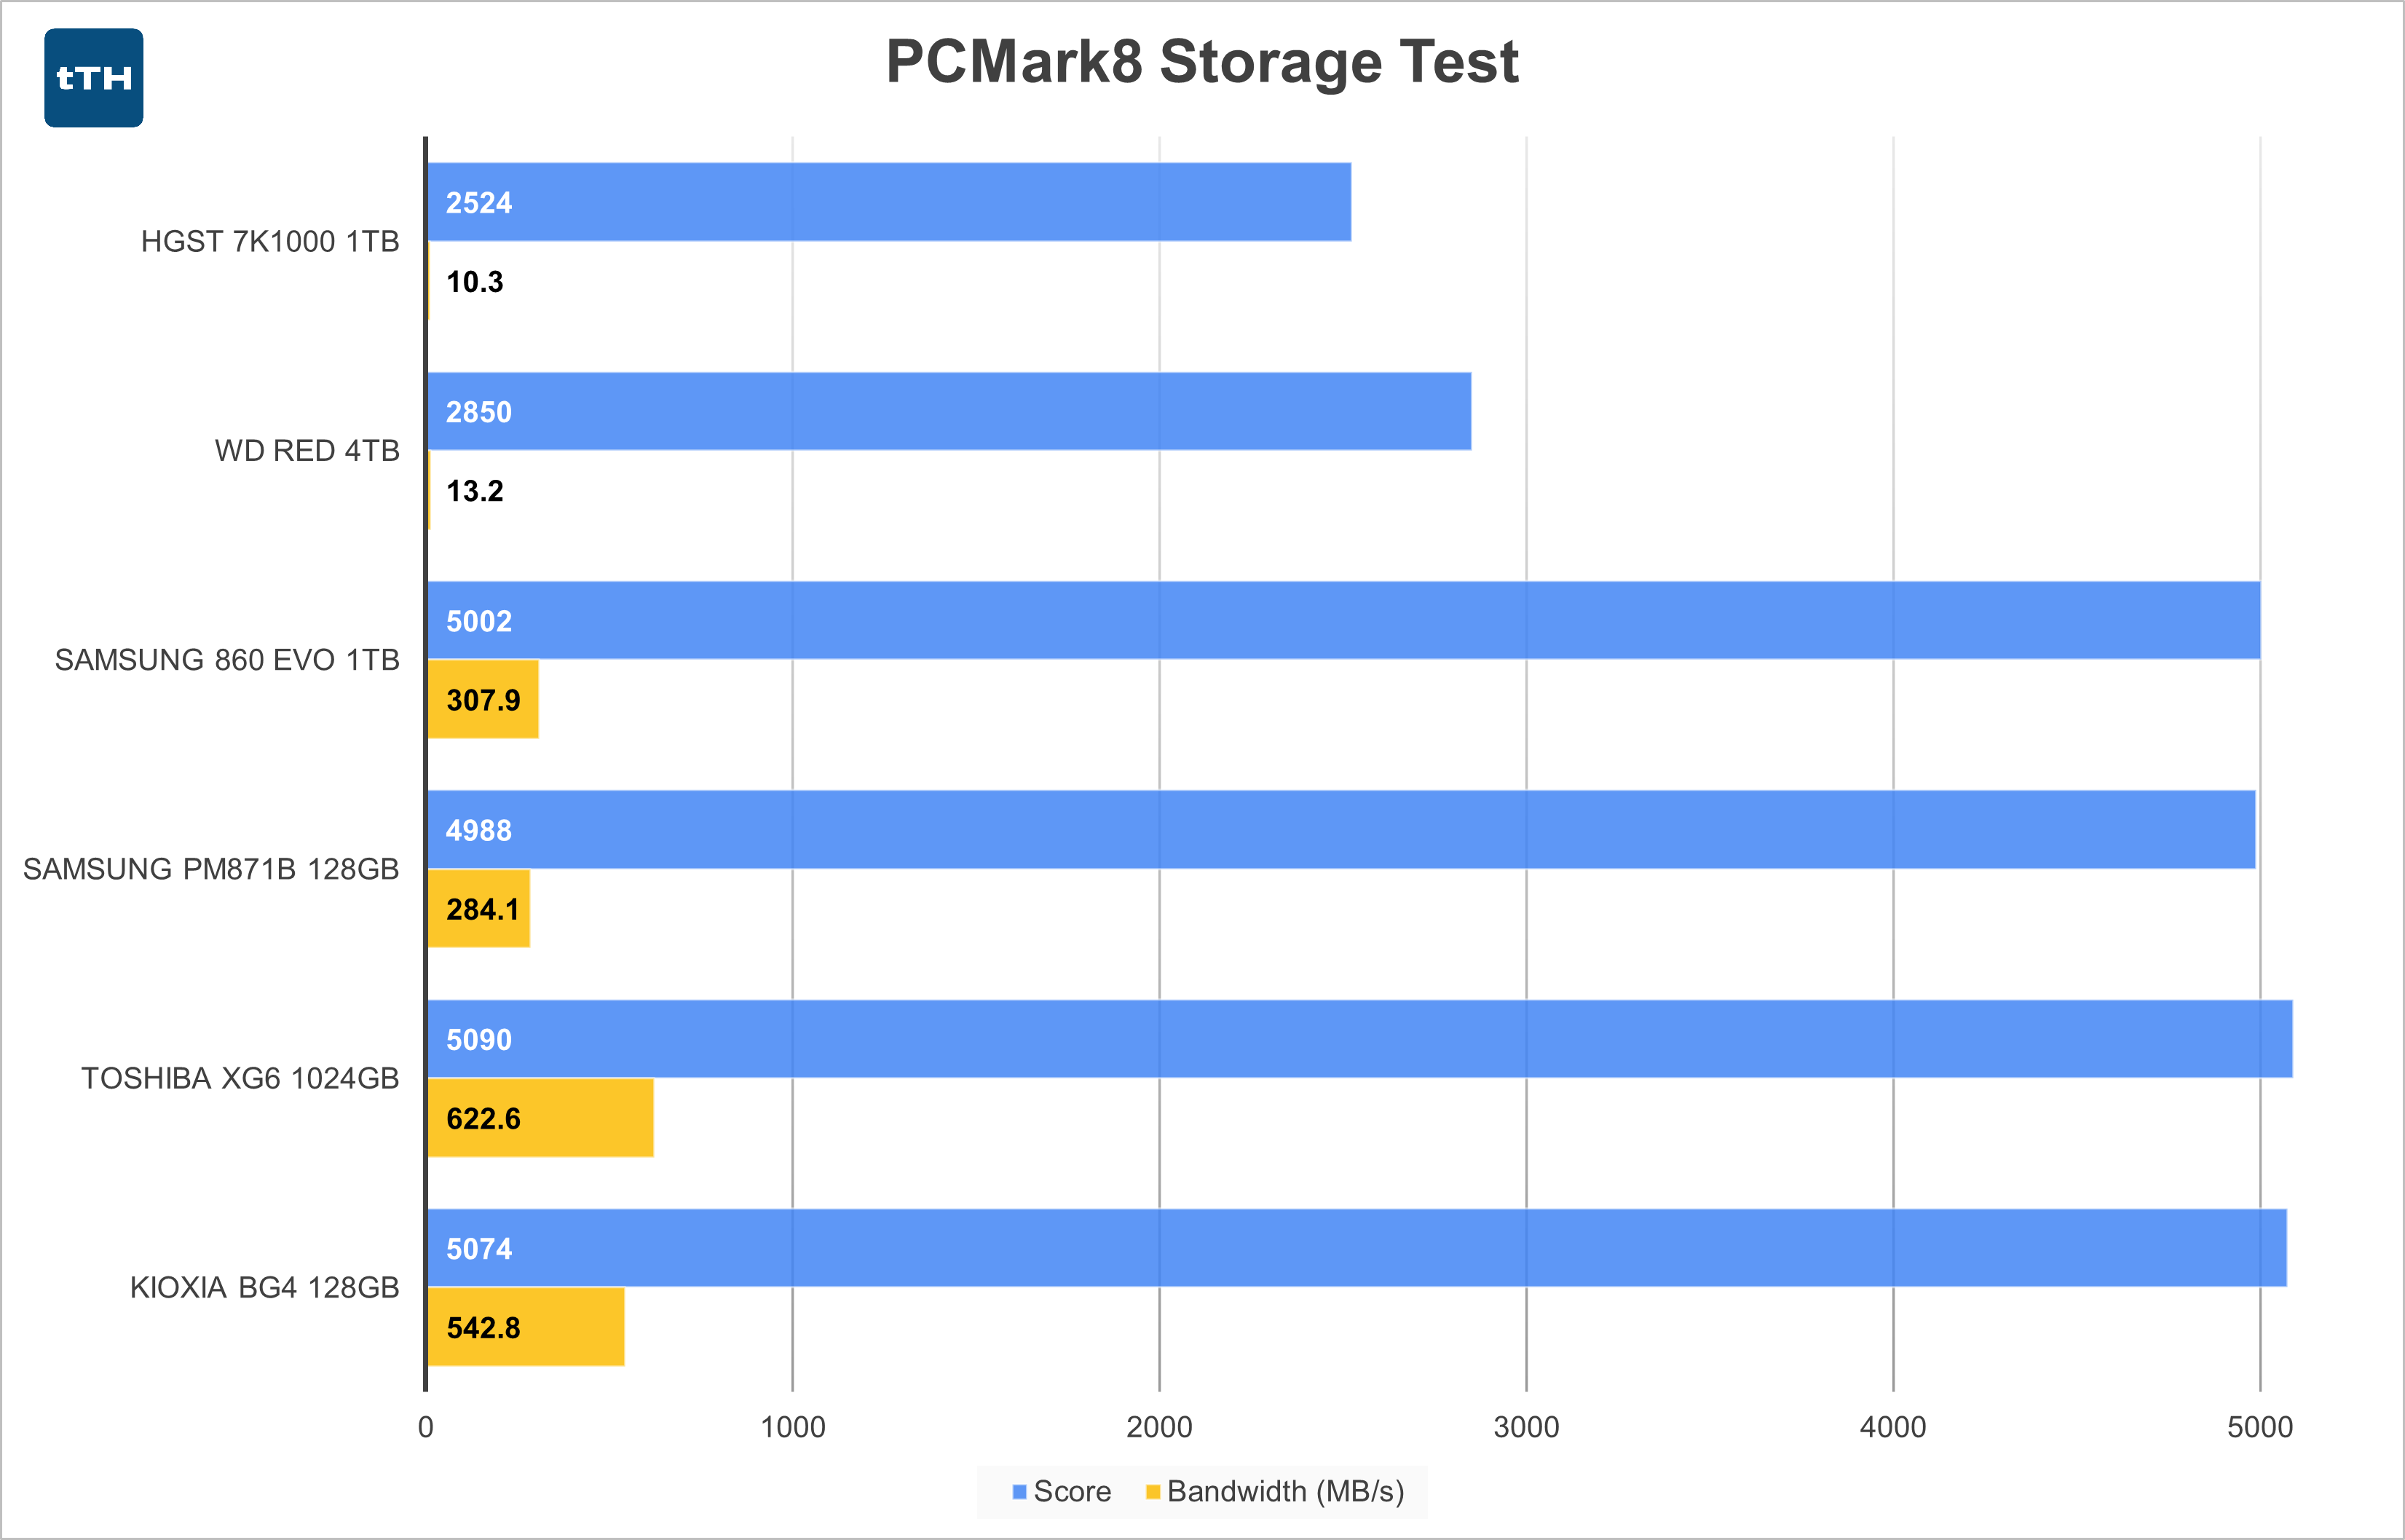 For the first time in all of my test runs we finally see some differentiation between drives. Despite the conventional hard drives showing just small fractions of the overall storage bandwidth of any of the SSDs, they still rate approximately half the Score in the PCMark 8 Storage Test.
Due to their mechanical nature, spinning disks can only inherently perform one set of operations at a time. The more operations you try to perform simultaneously, the more time the disk spends seeking and the less time it spends performing actual work. SSDs on the other hand have multiple channels of NAND flash that can be read from or written to simultaneously. Since these are attached electrically, there really isn’t even much of a performance impact in some cases, unless the controller isn’t fast enough to field all the in-flight commands simultaneously.
Despite this test being extremely old, it actually highlights some stark differences not seen when comparing various SSDs to each other. These differences will likely be further accentuated in more modern applications due to better optimization for SSDs (more parallel operations) and the fact that modern workloads are likely even more disk intensive now than they were in the past.
Digging into the details of the tests we see at one extreme (in this case the Adobe InDesign test) that an operation that takes 125 seconds on a spinning disk takes only 55 seconds on the 1TB XG6 – less than half the time. And these are not trivial amounts of time either with the times being separated by more than a minute. Other patterns like the video game loading tests have similar margins.
The PCMark 8 Storage test really illustrates why computers with SSDs, even slow ones, just feel so much more responsive in day-to-day application usage.
Large-File Transfer Tests
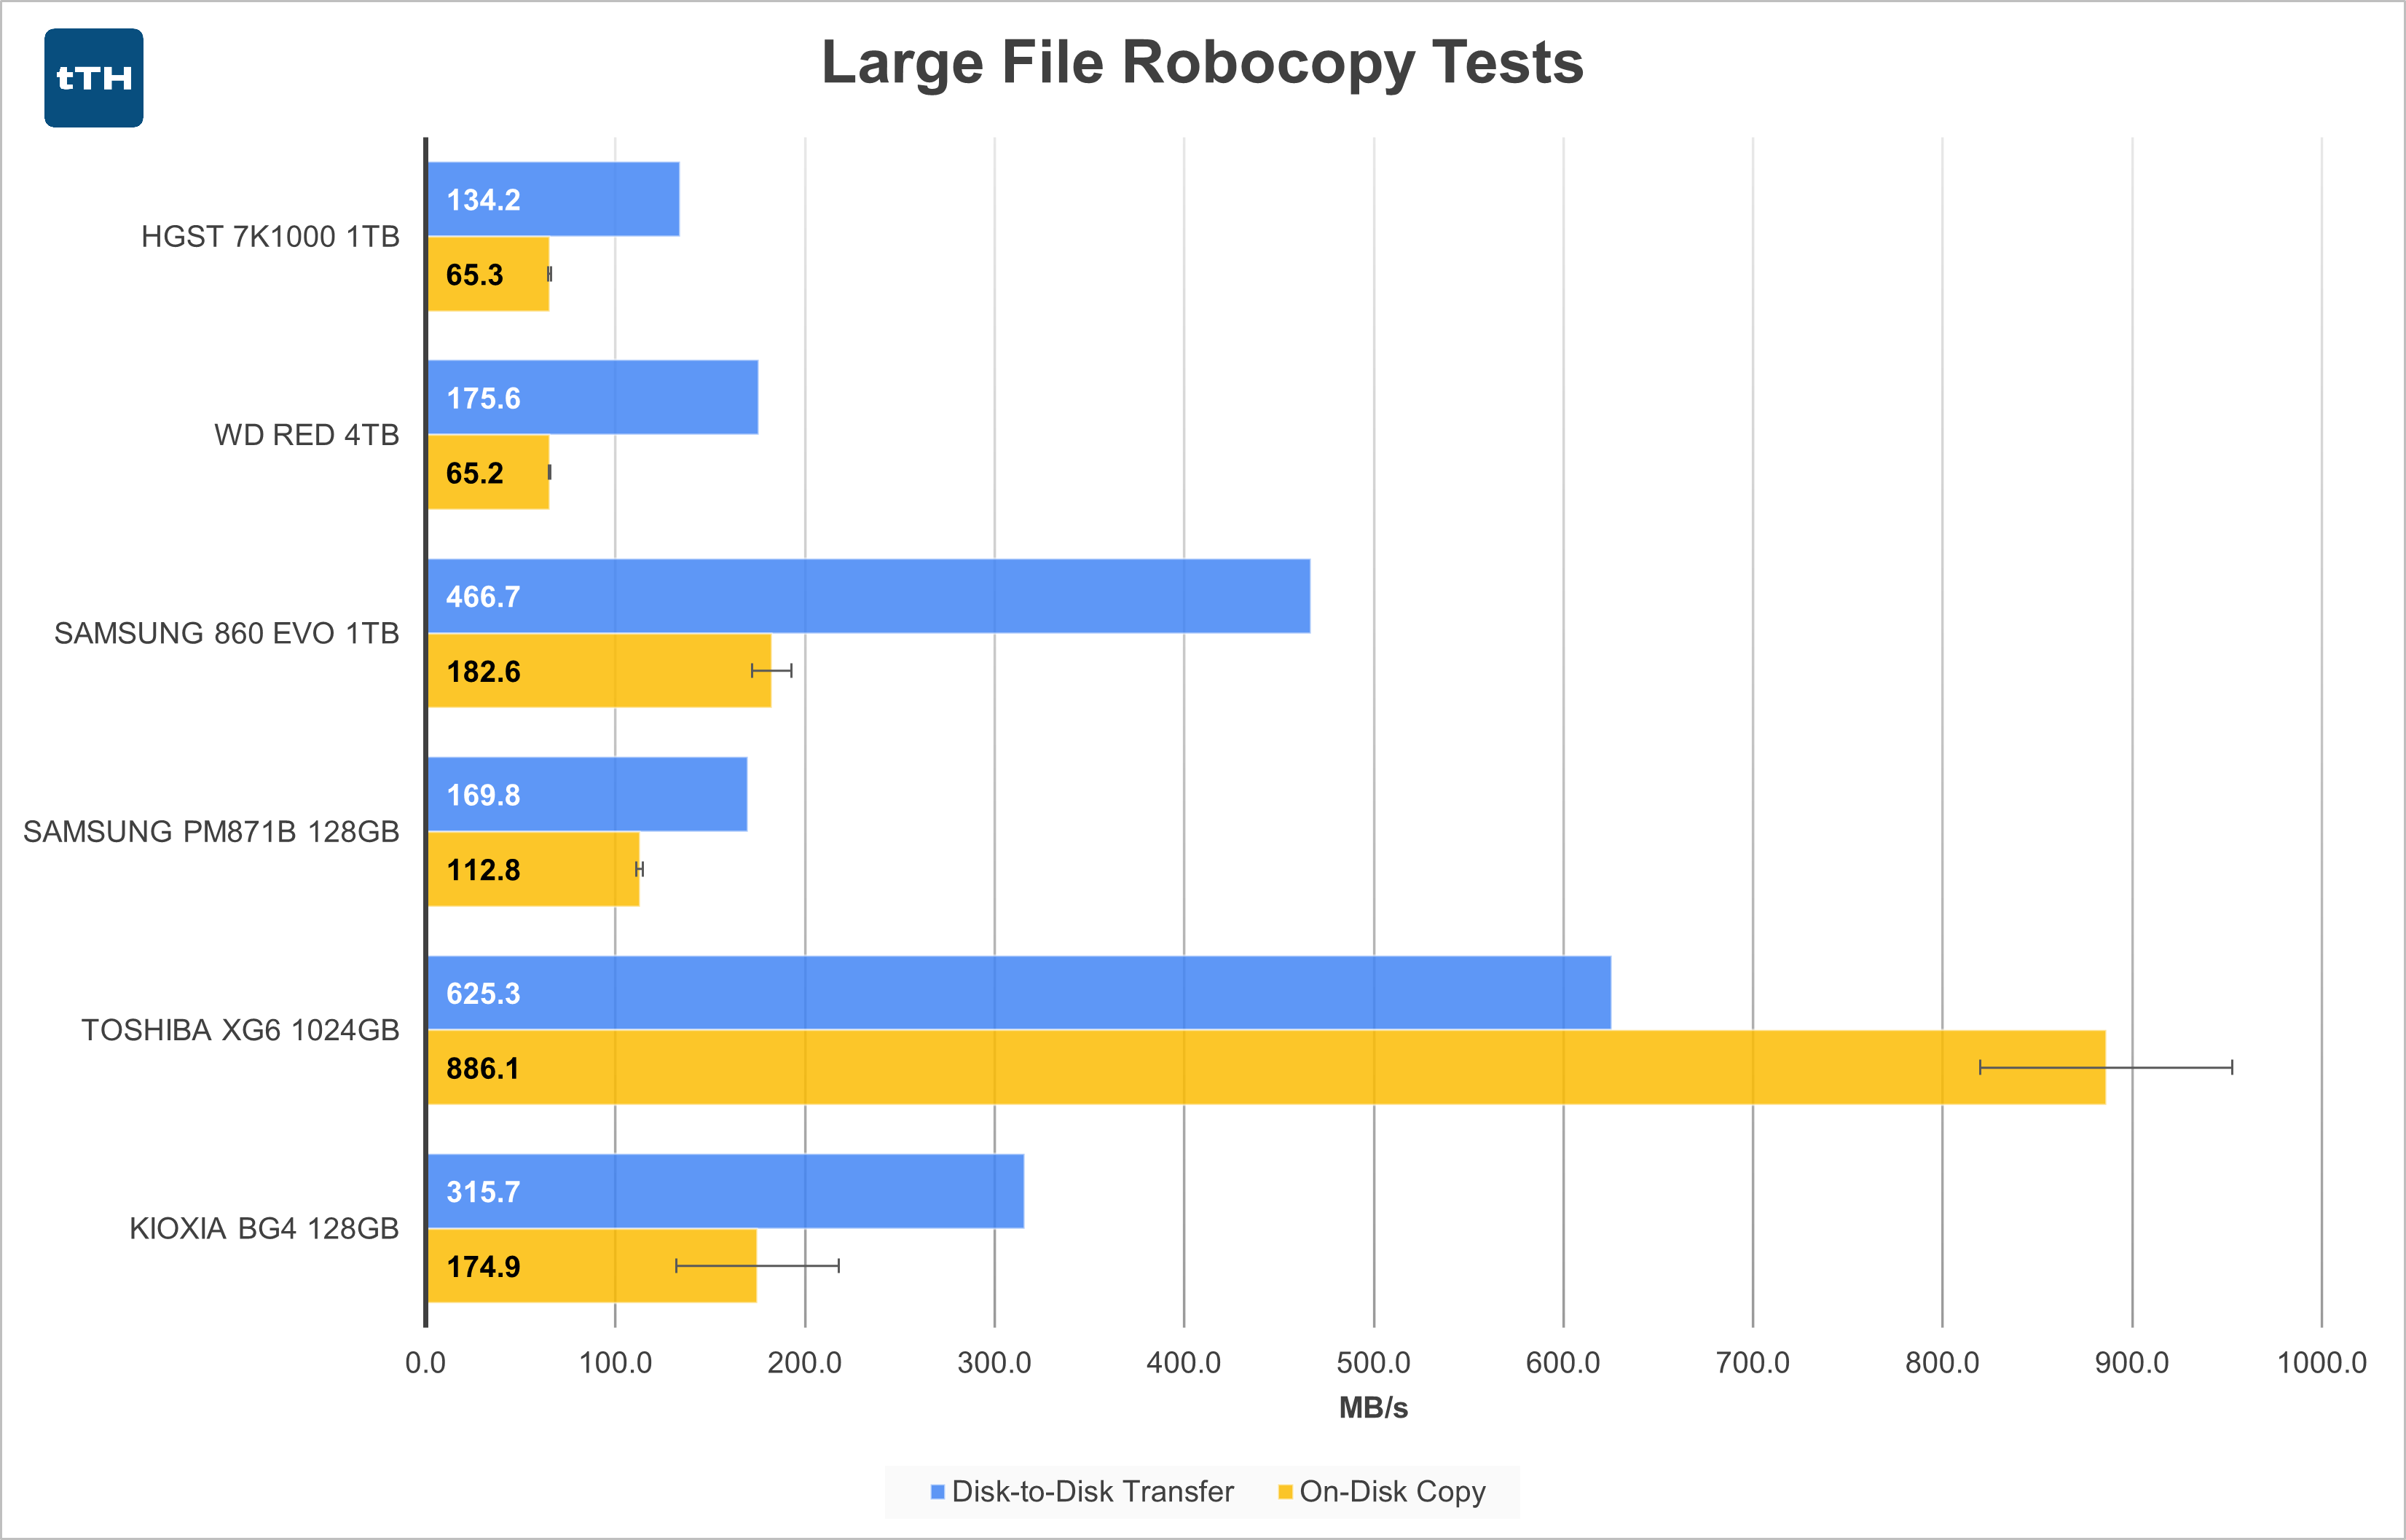 The Large File Disk copy test again shows the spinning disks in relatively good light. As I perform these tests on empty disks and delete the data between runs, the writes are always occurring on the fastest portions of the disk. As the amount of data is relatively small (just 10s of GB) when compared to the total capacity of the disks, performance does not have a chance to begin to degrade as the disks fill. The WD Red, not unexpectedly, returns slightly higher performance than the HGST drive, mirroring its linear write speed at the beginning of the disk.
In this test, compared to the WD drive the underwhelming PM871b is approximately at parity, the 128GB BG4 offers about 1.8x the performance, the 860 EVO offers about 2.7x the performance, and the XG6 outperforms by a factor of about 3.6x. As a reminder, due to the limitations of my 1st generation test platform, the Disk-to-Disk transfer performance of the XG6 is bottlenecked to a peak of ~750MB/s by the limitations of the test bench. The XG6 would provide significantly higher performance on an unrestricted system. This deficiency will be addressed in my next generation testbed.
Notably, as the disks fill, performance will decrease following the trend shown in the disk fill graphs above.
As stated above, spinning disks can only perform one operation at a time, so an on-disk copy is really not an ideal scenario. To complete the task, the disk must repeatedly read a section of data into its small read cache (only 32MB or 64MB for the disks in this test) and then reposition the head to an area with free space, write the cached data, and then return to where it left off to read more data. This caps the performance of an on-disk copy to less than half its peak performance. The speed is less than half due to the time needed for the head to reposition itself and then wait for the platter to rotate until the correct sectors appear under the head. In this test, the WD drive does not maintain its lead over the HGST, likely owing to its lower RPM causing longer seek times.
On-Disk copy performance ranges from 1.7x for the slowest SSD in the group to 13.6x for the fastest.
Small-File Transfer Tests
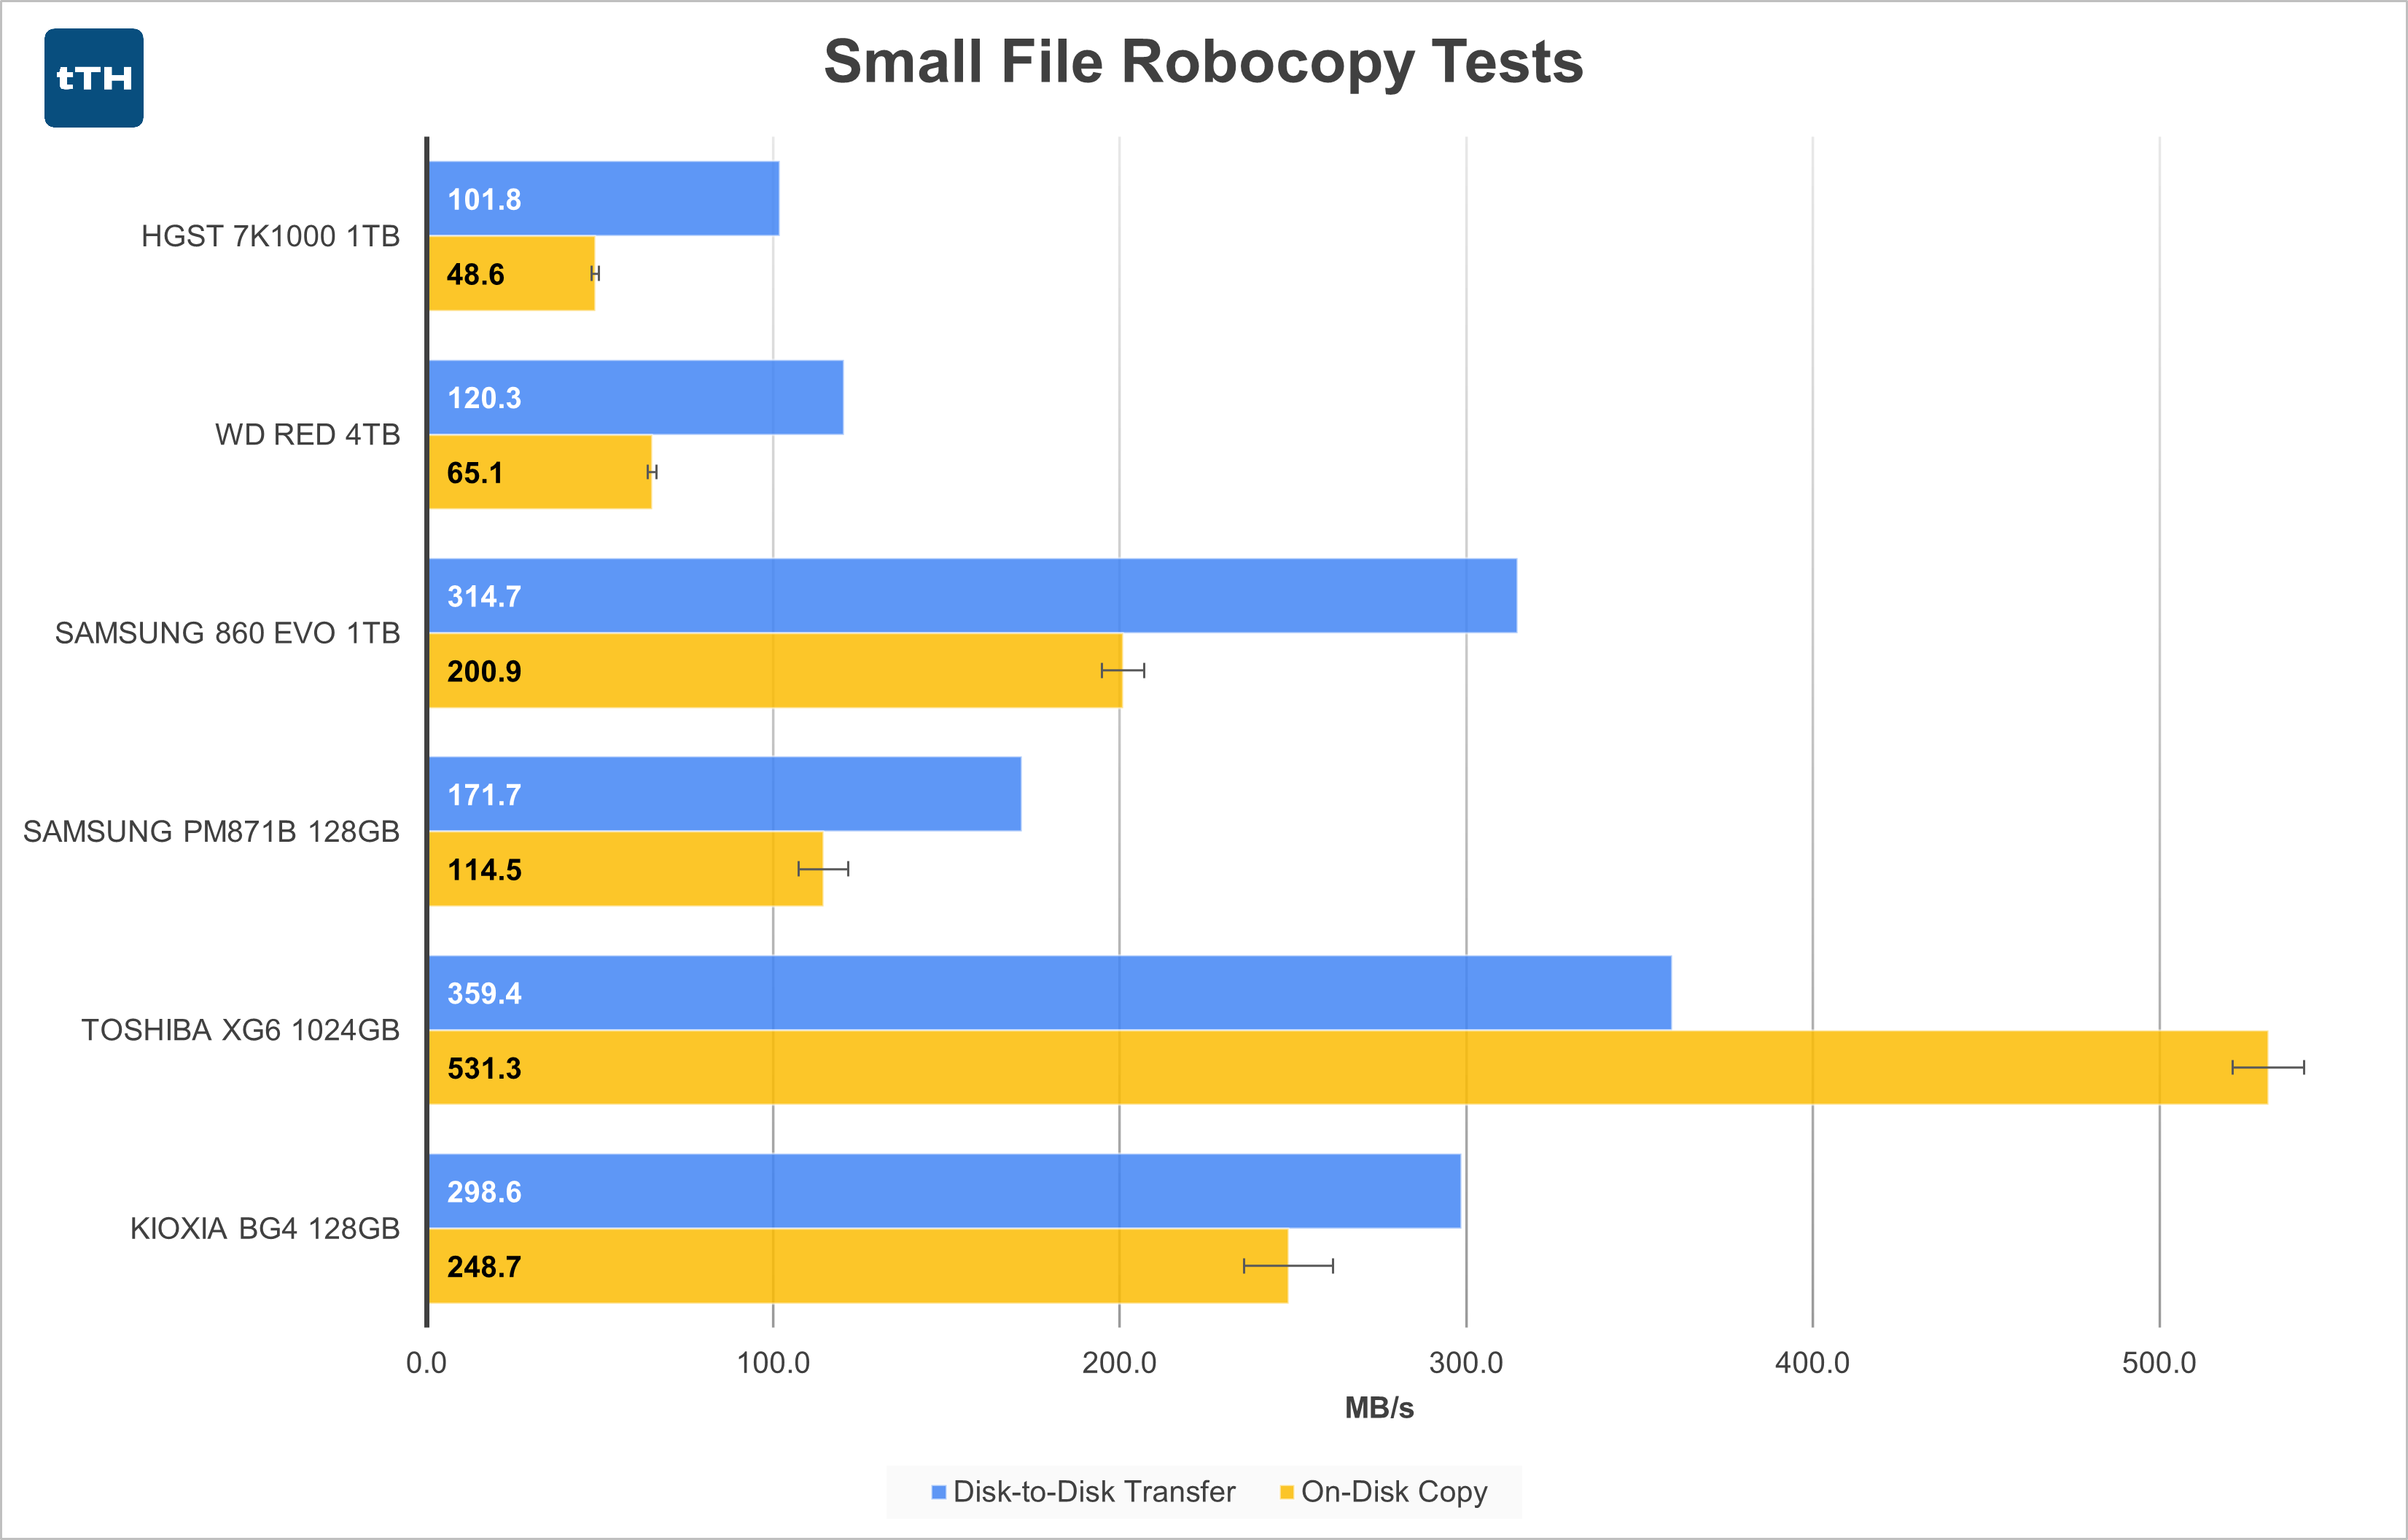 Both spinning disk drives perform slightly worse in the small file disk-to-disk copy operation when compared to the large-file disk-to-disk copy above. The WD Red leads the HGST drive by a similar ratio, just at a lower transfer rate. The SSDs also perform a bit slower in this scenario leading performance advantages ranging from 1.4x to 3.0x. Like in the large file disk-to-disk transfer, the XG6’s performance is somewhat bottlenecked in the small file disk-to-disk transfer. This deficiency will be addressed in my next generation testbed.
In the on-disk copy of small files, the HGST drive performs correspondingly slower, but the WD Red performs paradoxically faster. A larger cache and a smart drive controller may have lead to the head and platter rotation aligning in an ideal manner that lead to very little time wasted on seeks. Still, performance is down considerably compared to all of the SSDs which take much smaller hits for on-disk copy operations leading to performance advantages ranging from 1.8x to 8.2x.
Conclusion
I have to admit, I was exited when I realized that it might be interesting to run some traditional HDDs through a test suite aimed at SSDs. Though my v1 Methodology isn’t the most challenging set of tests for SSDs, spinning disks are definitely at a disadvantage.
In this day and age there really isn’t any doubt that SSDs outperform traditional spinning disk HDDs. The question is simply to what degree. For basic sequential operations, spinning drives tend to fall behind decent SSDs by single digit multiples, with low-end SSDs sometimes only matching performance and high end SSDs reaching over 10x performance. Especially at the higher end of this range, these kinds of differences are definitely noticeable. Still, where SSDs really begin to walk away with the performance lead is in small random I/O where this collection of SSDs range deliver no less than 49x the performance and reach as much as 79x the performance of spinning drives. Differences of this magnitude result in night and day differences in experience, which for these types of operations translates directly to application performance.
This stark difference illustrates why I would (and have for years) strongly recommend that anyone who uses a computer regularly, whether for business or pleasure, invest in an SSD for their OS and primary applications. The performance that can be gained by using an SSD is higher now more than ever due to faster and faster CPUs that can consume data from storage more quickly leading to idle time while waiting for additional data to be read from disk.
Though outside the scope of this article, in many day-to-day tasks that aren’t compute bound, an old/slow computer with an SSD can easily feel faster than the latest and greatest machine with a spinning disk.
I’m not saying that spinning disks are dead. They have their place. Large media libraries cost significantly less to store on spinning disks than SSDs, and performance is often not paramount when the data rate to playback even raw Blu-Ray video is a fraction of what a HDD can sustain. The least expensive 4TB SSDs cost over $400 at the time of this writing, while the WD Red 4TB in this review costs just over $100. The proposition gets even more dire for SSDs at larger capacities. And if you need drives over 8TB, at least for the time being, your only consumer grade options are traditional HDDs, not SSDs. Just don’t forget to back up your data! Having all that data on one drive could lead to catastrophe if the disk fails. RAID or ZFS pools can help mitigate risk, but as the storage communities always say, RAID is not a replacement for having a backup.