SATA SSD Roundup - Large, But No Longer In Charge
A roundup review of the SATA SSDs I have available on my testbench SSD Using Testbed v1.0 and Methodology v1.0.
Jan 21, 2021
- Benjamin Wachman
Tags:
#Methodology-v1
#Testbed-v1
#SSD
#SATA
#Roundup
In this review I’ll be doing what I can to fill in some blanks as to what the performance of SATA drives looks like in comparison to the previously reviewed NVMe by drives testing several SATA drives from Crucial, Intel, and Samsung.
Intro
With SATA SSD as long in the tooth as they are and with entry-level PCIe NVMe drives at or near price parity ($/GB), there doesn’t seem to be much reason for the average consumer to be interested in a SATA SSD. Just a year or two ago, NVMe SSDs - even entry level models - commanded a substantial price premium. As such SATA continued to find a place in budget-conscious computer systems. Even high capacity NVMe SSDs, another former bastion of the physically larger 2.5” drives, are now becoming possible with increased NAND densities allowing 8TB M.2 drives, though these are still pretty pricey whether they’re SATA or PCIe.
If the terms “SATA” and “NVMe” are throwing you off, check out my recent brief explanation in SSD Terminology Overview Part 1 - Formfactors, Buses, and Protocols. To that end, all M.2 drives I’ve tested thus-far are PCIe and NVMe based. I currently don’t have any SATA M.2 drives to test nor do I have any (older) AHCI based PCIe drives, M.2 or otherwise. As such, at least for this article, I’ll be using the terms “PCIe” and “NVMe” interchangeably.
M.2 slots have become nearly ubiquitous on motherboards and in laptops over the last several years, so at least for the casual user who only needs one drive, there’s always at least the possibility of adding an M.2 drive rather than a 2.5” SATA model if preferred.
Of course if you’re upgrading an older system or you need more drives than can be accommodated by the 1-3 M.2 slots in your system, then SATA is still necessarily the way to go.
Before I get too far, if you want to know more about how I perform the tests in this review, check out my first blog post: SSD Review Background, Setup, and Methodology v1.0. My first round of reviews will all use the same Testbed and Methodology, so will be directly comparable.
The Drives:
| The Drives - Table of Specifications | |||||
|---|---|---|---|---|---|
| Crucial MX500 | Intel 520 | Samsung 850 EVO | Samsung 860 EVO | Samsung PM871b | |
| Formfactor | 2.5in | 2.5in | 2.5in | 2.5in | 2.5in |
| 'Capacity | 500GB | 180GB | 500GB | 1000GB | 128GB |
| Interface | SATA III | SATA III | SATA III | SATA III | SATA III |
| Seq Read | 560 MB/s | 550 MB/s | 540MB/s | 560MB/s | 540MB/s |
| Seq Write | 510 MB/s | 520 MB/s | 520MB/s | 520MB/s | 500MB/s |
| I/O Read | 95K | 50K | 98K | 100K | 68K |
| I/O Write | 90K | 60K | 90K | 90K | 80K |
| Active Power | 4.0W | 0.85W | 4.4W | Not Listed | Not Listed |
| Idle Power | 2mW/55mW | 600mW | 2mW/50mW | 2.5-7mW | Not Listed |
| Components | SM2258 + 512MB DRAM + NAND | SF-2281 + NAND | Samsung MGX + 512MB DRAM + NAND | Samsung MJX + 1GB DRAM + NAND | Samsung Controller + NAND |
| NAND | Micron 64-layer 3D TLC | Intel 25nm Planar MLC | Samsung 32-Layer 3D TLC | Samsung 64-Layer 3D TLC | Samsung Planar TLC |
| Rated Endurance | 180TBW | 36.5TBW (20GB/day) | 150TBW (82GB/day) | 300TBW | Not Listed |
| Retail/OEM Drive | Retail | Retail | Retail | Retail | OEM |
| Cost Today | $54 | ~$24 (used) | ~$55 (used) | $109 | ~$20 (used) |
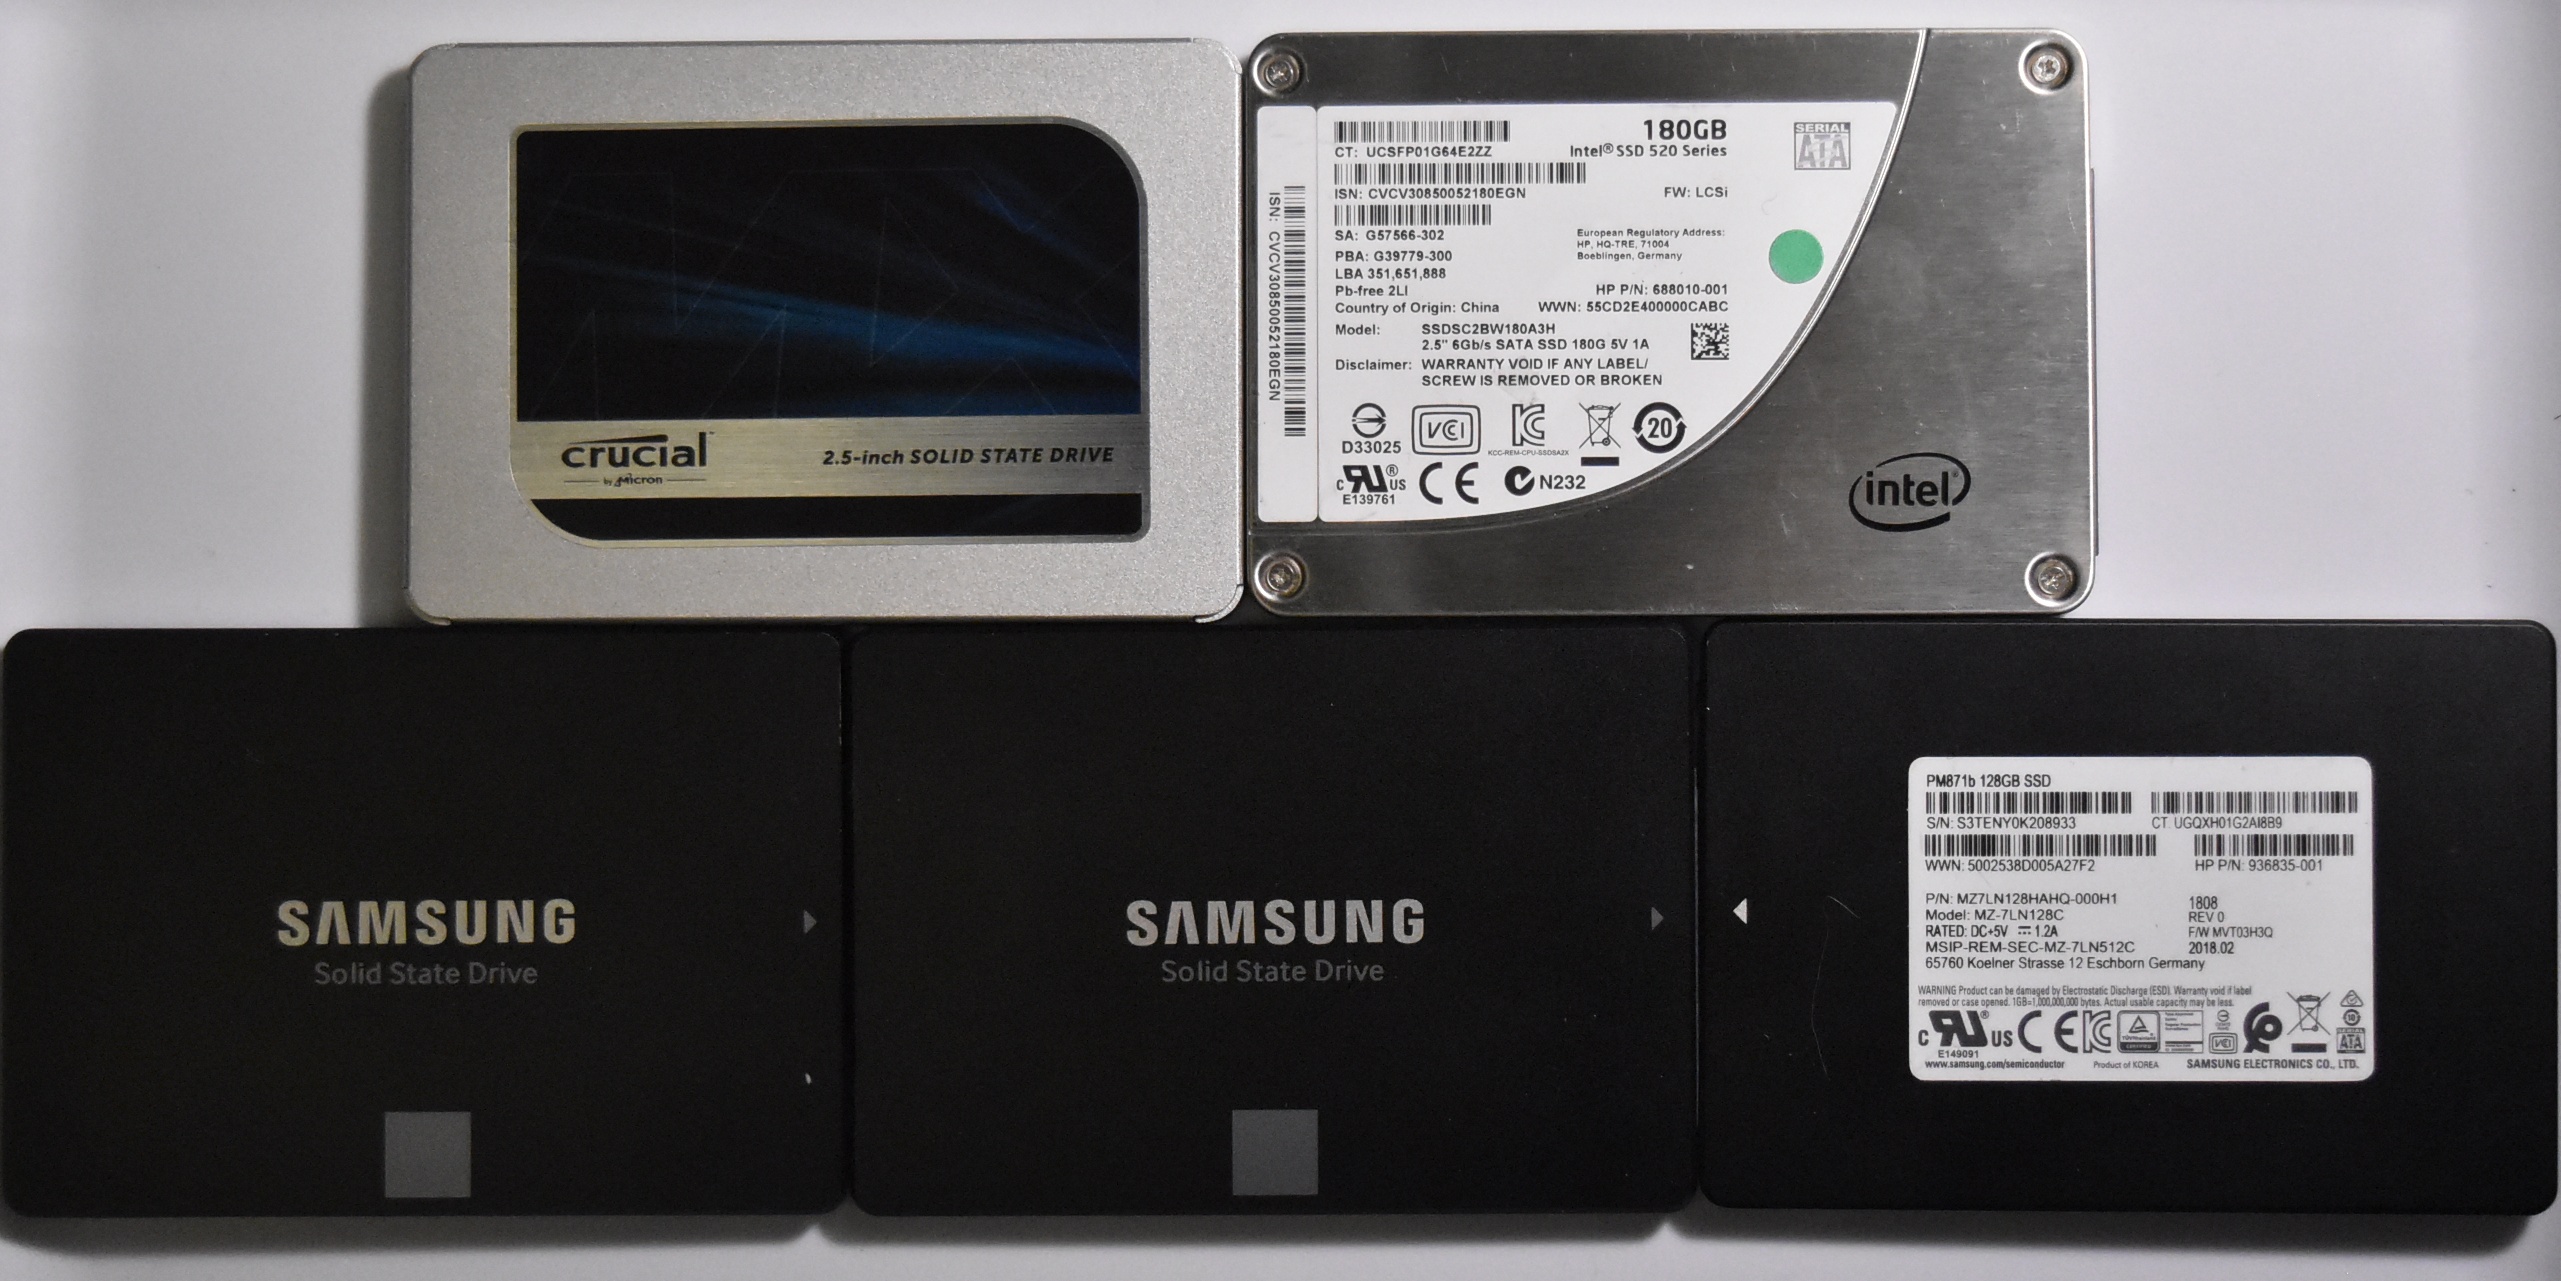
The drives in this roundup have come from various sources. The MX500, 850 EVO, and 860 EVO are all drives that I bought new, at retail at various points over the last several years. The Intel 520 is a retail drive, but I purchased this unit used because I needed a cheap “check the box” SSD for performing file transfers, backups, and for temporary boot drives. As such, neither the MSRP nor the price I paid for each of these drives accurately reflects what the drives would cost today. I’ve done my best to source accurate pricing as of this writing.
Crucial MX500 500GB
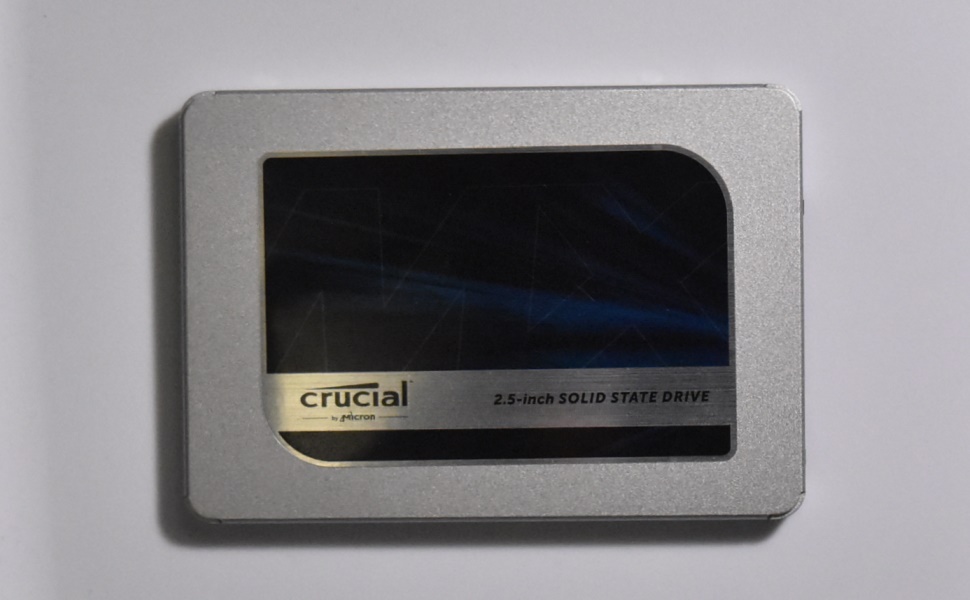 Released in Late 2017, the MX500 is the most recent (and likely last) entry in a long line of mainstream consumer SATA SSDs from Crucial. The MX500 introduced Micron’s 64-Layer 3D TLC which provided significantly better performance than their previous generation 32-Layer 3D TLC. This lead to the MX500 being moderately competitive, more so than several of their previous generations of mainstream (MX) and entry (BX) drives
Intel 520 180GB
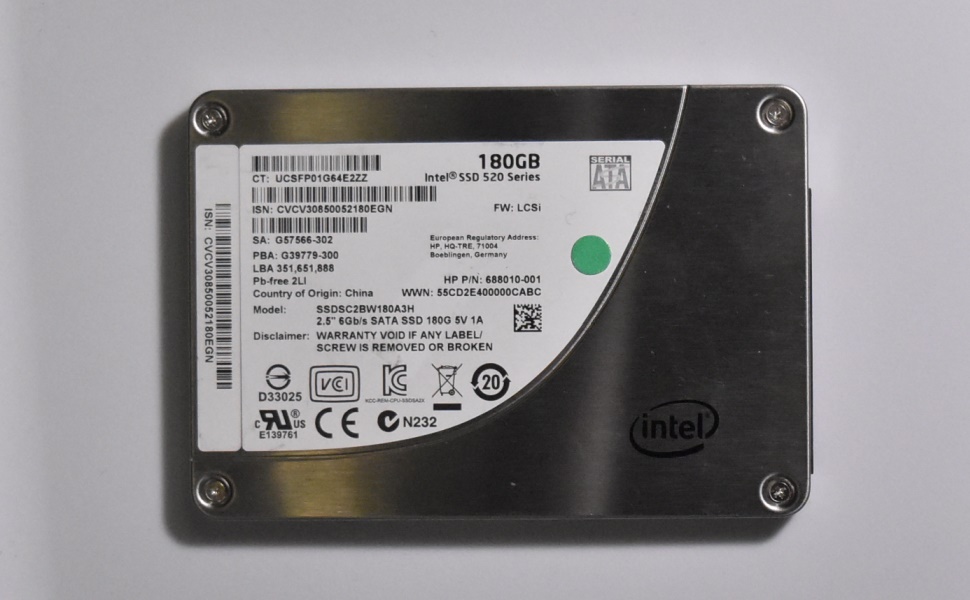 Released in 2012, the Intel 520 SSD (Codename Cherryville) is a relatively early SATA III drive based on a 2nd generation Sandforce controller, the SF-2281. It was an example of a DRAMless SSD design from another era before the practice recently came back into vogue for low-end, low-cost drives. Sandforce’s controllers were revolutionary at the time due to a realtime data compression engine that compressed data before writing it to NAND leading to improved performance and fewer writes to NAND, increasing endurance somewhat.
Of course, data varies in its compressibility, leading to rather varied write performance depending on what you were writing to your drive. There were also some odd corner-cases that happened when you filled the entire drive with uncompressible data – the drive assumed that at least SOME of your data would be compressible.
Sandforce had newer controller designs in the pipeline when they were acquired several times in relatively quick succession by LSi and then Seagate before essentially disappearing from the SSD space. To the best of my knowledge we’ve never seen a true successor to the wildly popular SF-2281 using Sandforce intellectual property.
Samsung 850 EVO 500GB
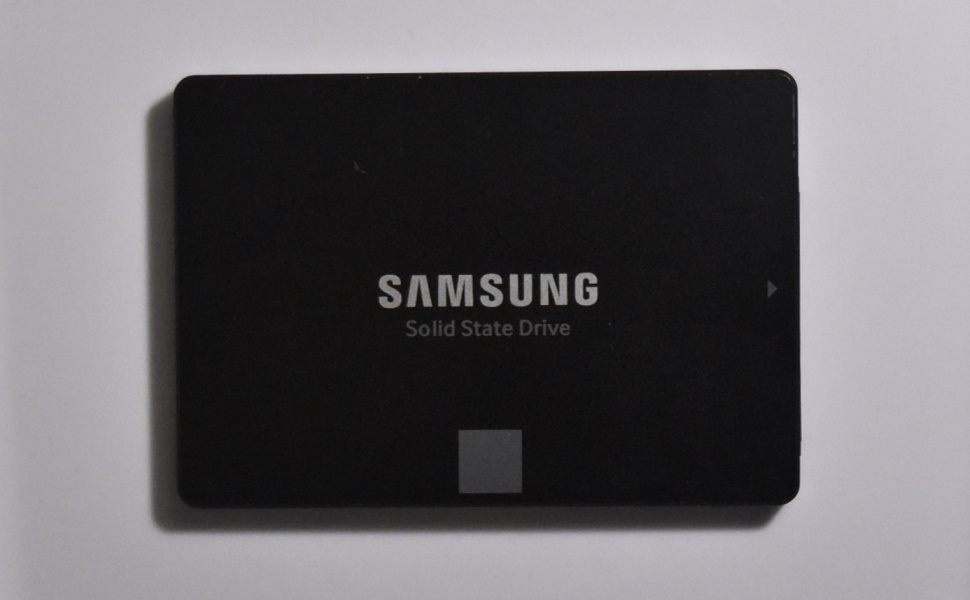 Released in 2014, the 850 EVO was a very successful follow-up to the previous generation 840/840 Pro. The new EVO moniker brought with it considerably more performance at a lower price point compared to the previous vanilla 840 where in some cases the new EVO outperformed the previous generation 840 Pro. The 850 series accomplished this primarily through the use of newer faster controllers that supported the first consumer release of 3D NAND that Samsung called V-NAND – which was considerably faster than the 15-19nm planar MLC or TLC NAND that competing drives were using at the time.
The 850 EVO essentially saturated the SATA bus, even at SATA III speeds, leaving little room for large-scale performance improvements down the line. Over the years, Samsung quietly updated the NAND to newer generations of 3D TLC and added higher capacity models, some of which ended up using newer controller revisions.
The drive model existed for many years before being replaced by the 860 EVO series with little fanfare.
Samsung 860 EVO 1000GB
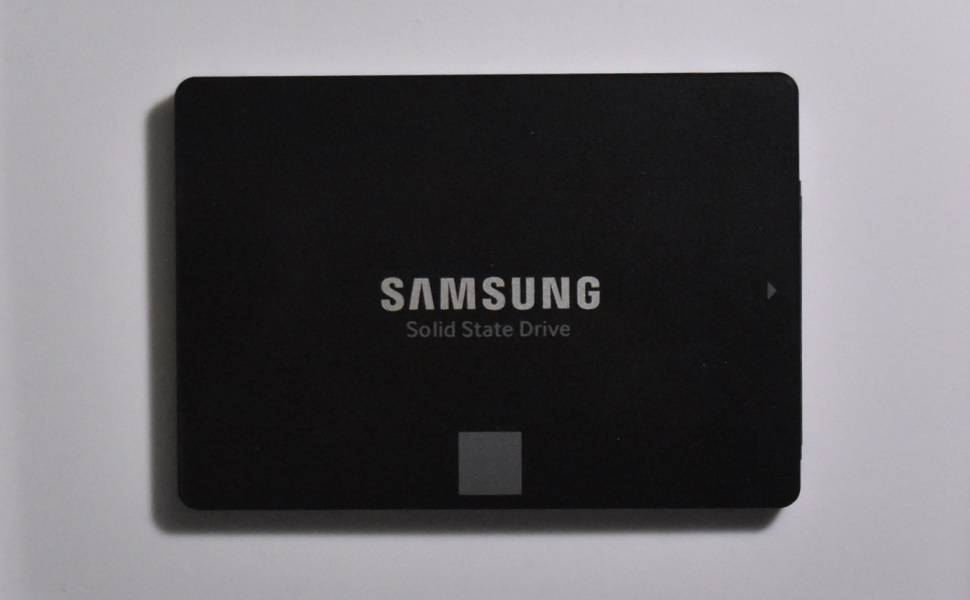 Released in 2018, essentially a mild update of the popular and already segment-leading 850 EVO series, the 860 EVO brought an updated controller, support for newer lower power LPDDR4, and a new generation of 3D TLC NAND across the board. In photos, the 860 and 850 EVOs are nearly indistinguishable from each other without looking at the model number written on the sticker on the back of the drive.
At the same drive capacity, an 860 EVO mostly performs similarly to 850 EVO drives, trading blows in various metrics.
As I was finalizing this post, Samsung announced the 870 EVO series, replacing the 860 EVO.
Samsung PM871b 128GB
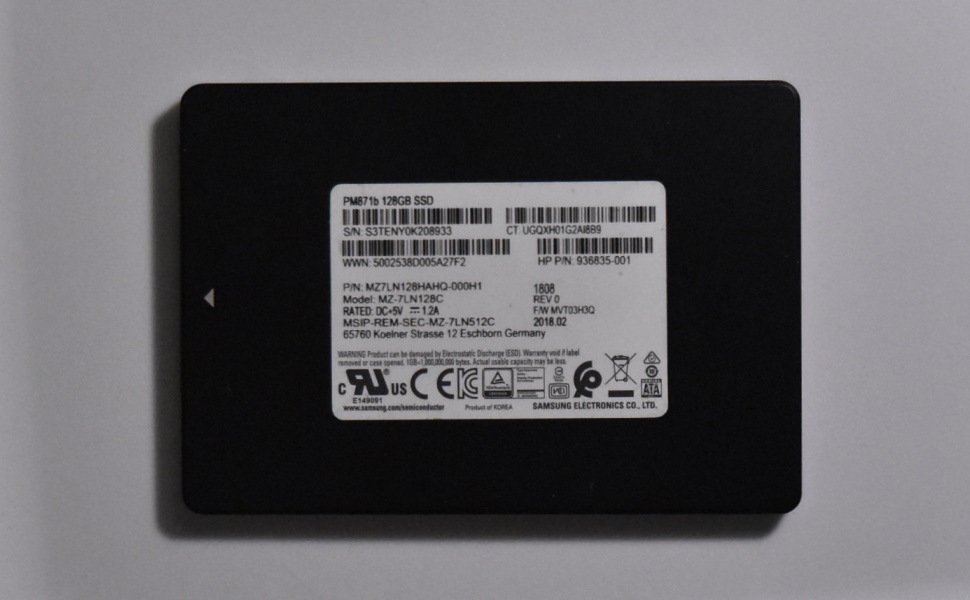 A low-end OEM drive likely released sometime in 2017. This particular example was pulled from a laptop I bought and was replaced with a larger capacity model. Samsung publishes precious little information about their OEM drives. From what I can glean, the drive still uses planar TLC rather than 3D TLC, and as such its endurance and sustained write performance are likely lower than drives with 3D NAND, but there’s no spec sheet to refer to.
Review
To keep the graphs from getting too cluttered, I’ve used the 128GB Kioxia BG4 as a representative of the low-end/low-capacity NVMe drives from the first roundup and have kept the 1024GB XG6 as an example of a moderately high performance NVMe drive. If you’d like to compare the performance of additional tested drives, these results are directly comparable to any other measurements I’ve performed with Methodology v1.
In case you didn’t catch my note at the top, if you’d like to know more about my hardware setup as well as my testing methodology, check out my SSD Review Background, Setup, and Methodology v1.0 piece.
Write Test — Disk Fill Summary
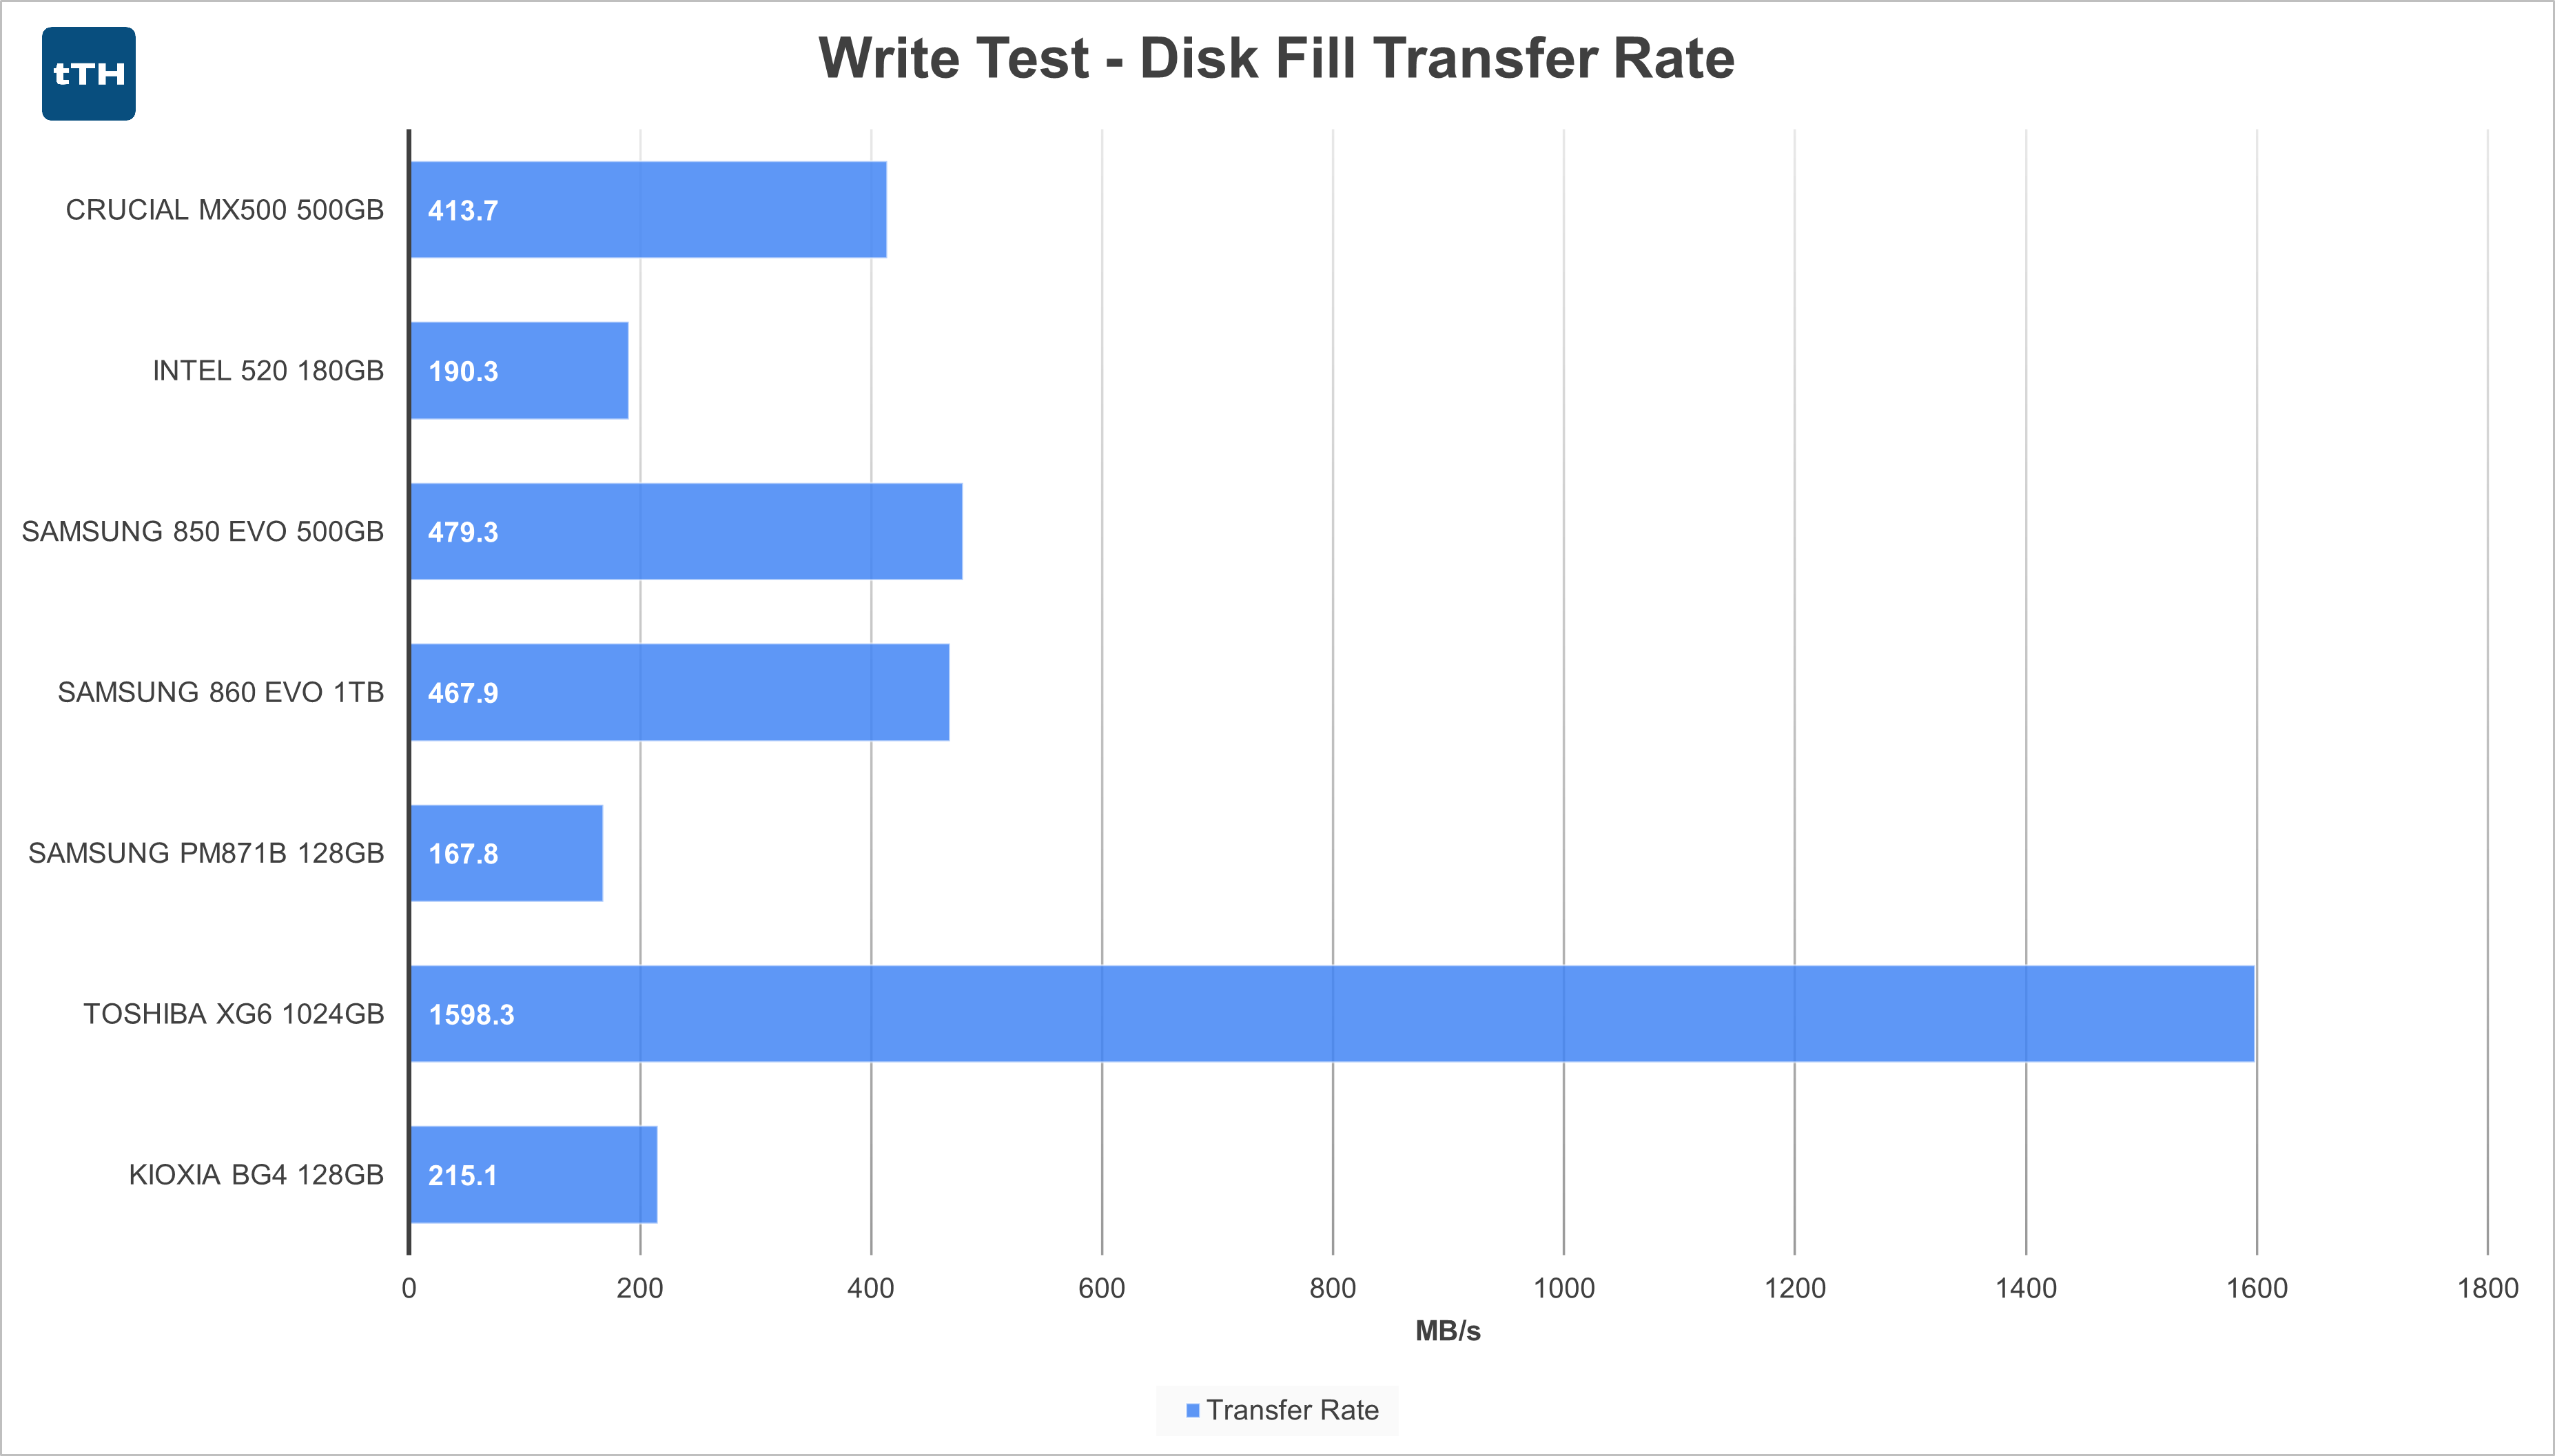
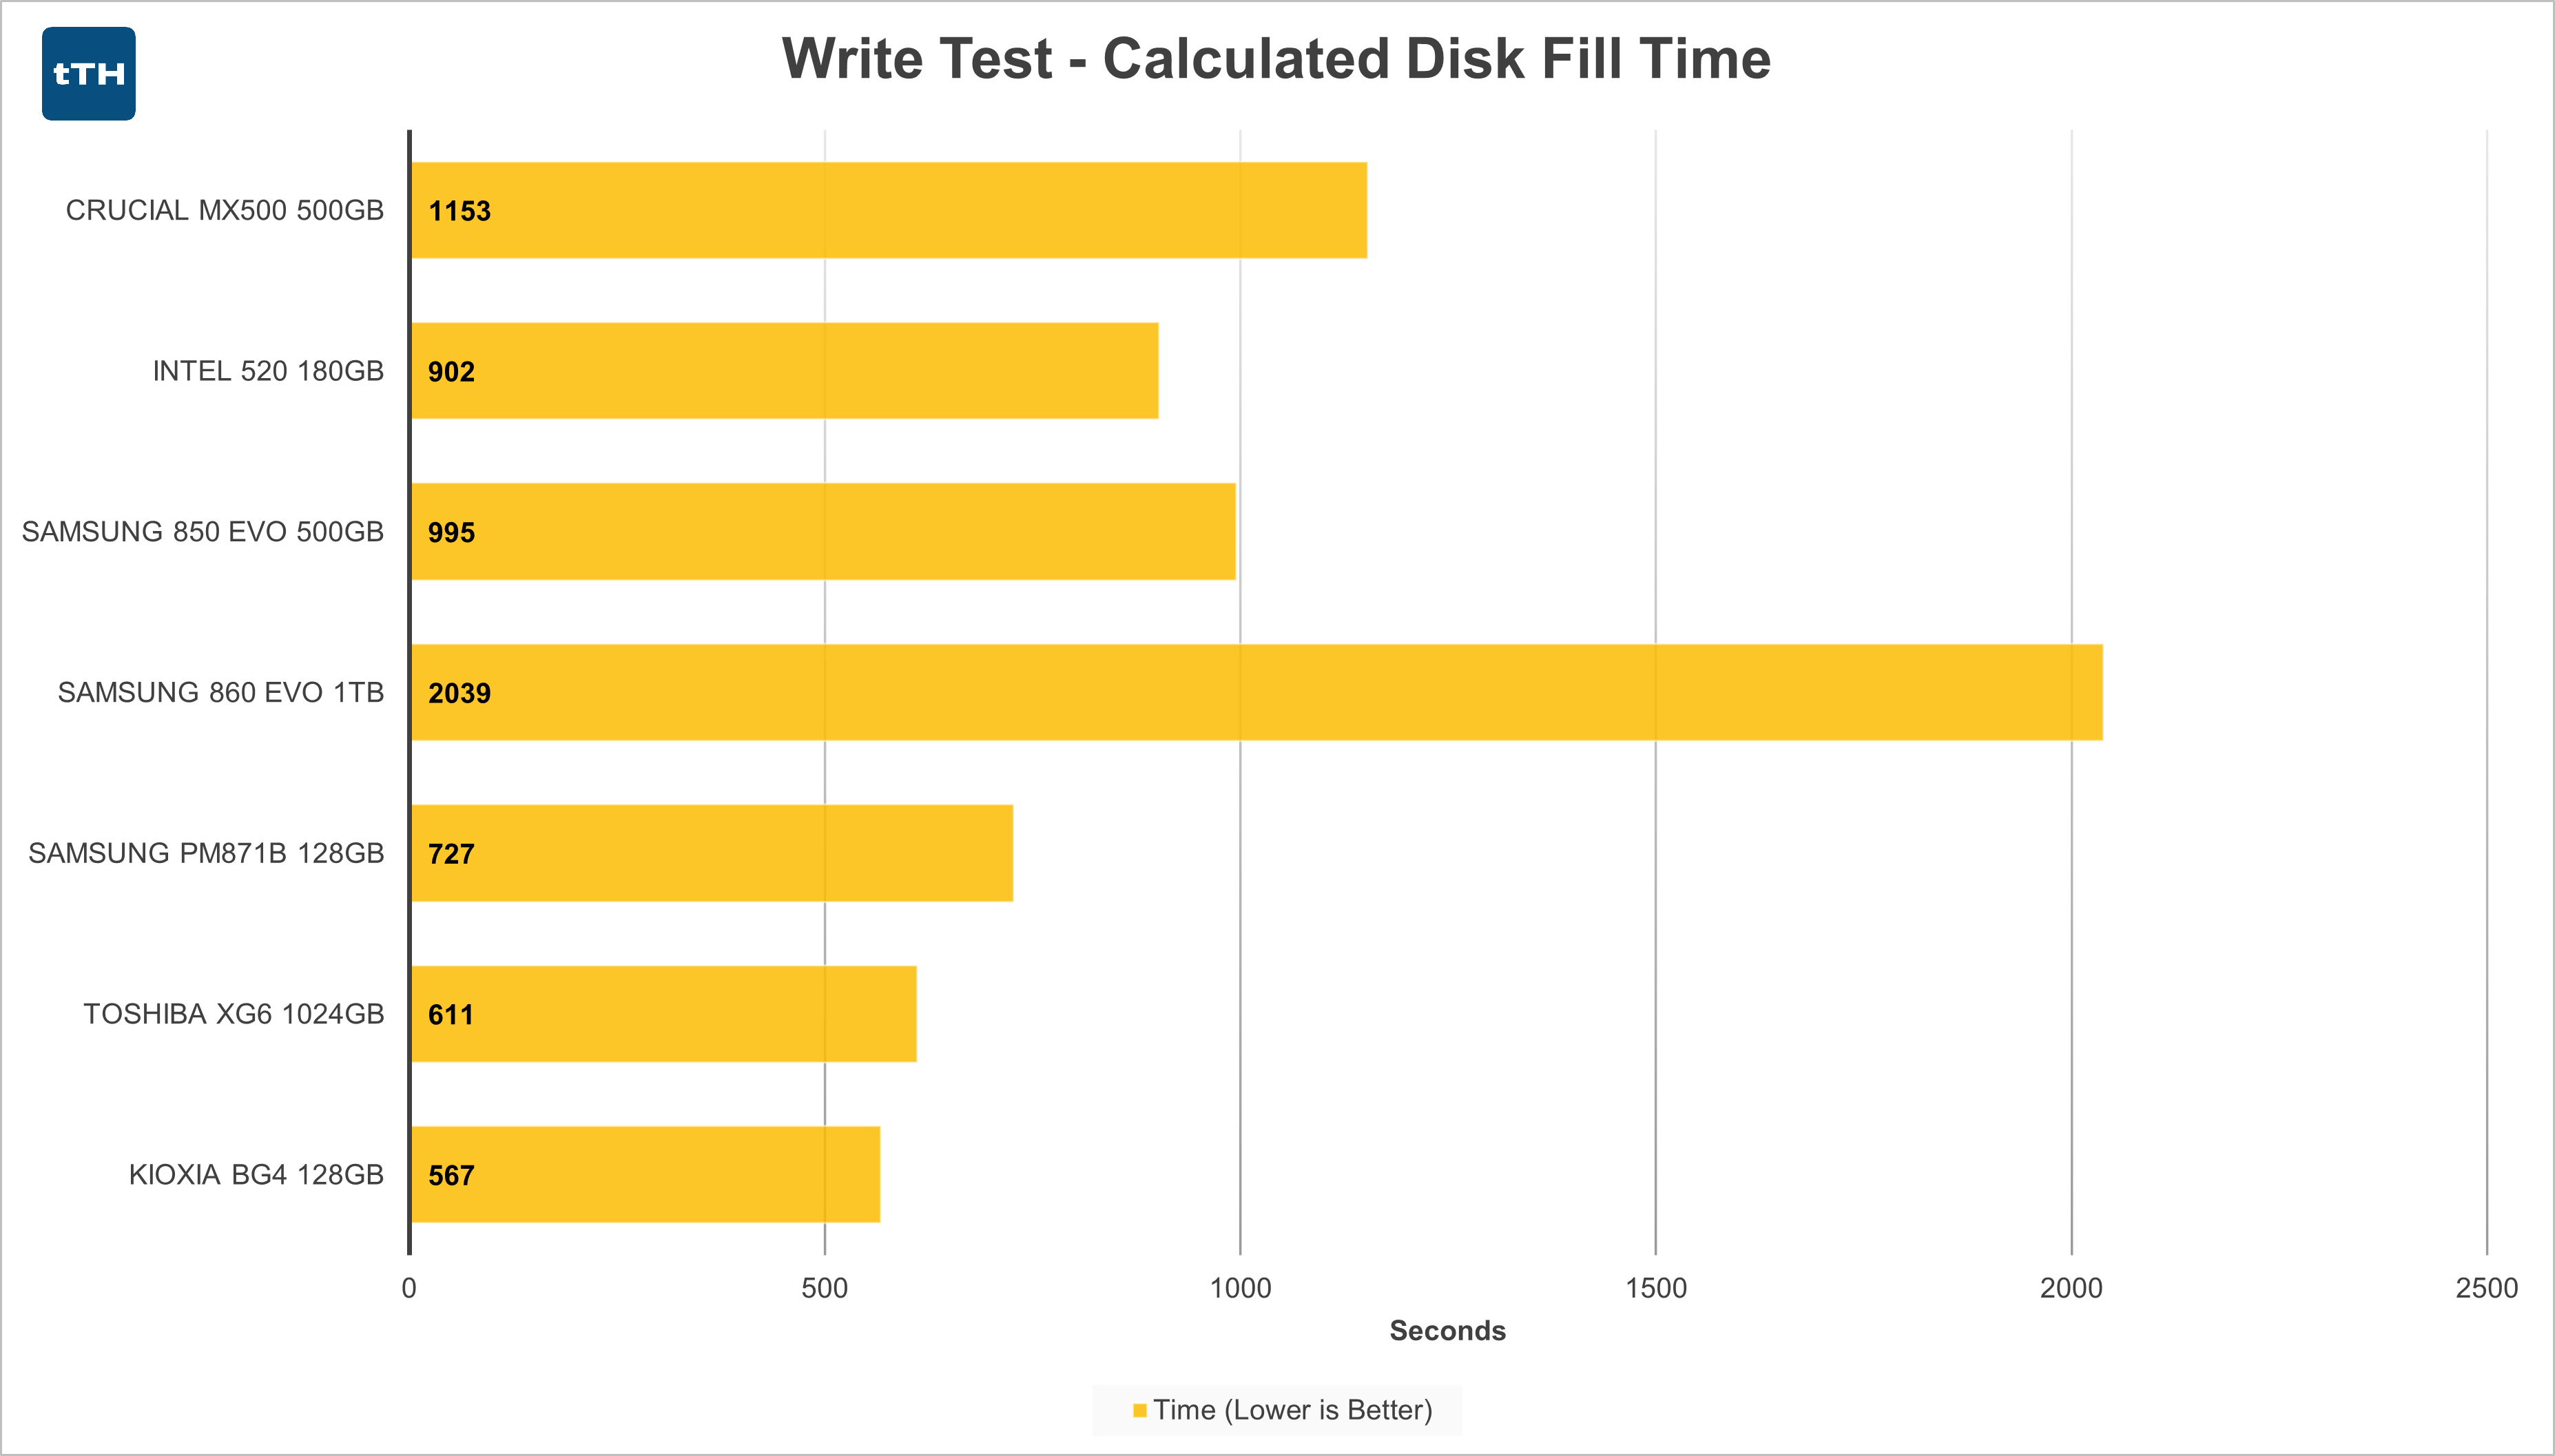 Here we see that the 500GB and 1TB drives, the 850 EVO, MX500, and 860 EVO all significantly outperform the 128GB entry-level NVMe drives from the initial roundup in the Disk Fill test – represented here by the 128GB BG4. The OEM 128GB PM871b and relatively ancient Intel 520 both underperform the BG4 but come out ahead of some of the worse performing 128GB NVMe drives. To no real surprise, the XG6, which both peaks and sustains several times several times the bandwidth of SATA, leaves the rest of the competition in the dust.
If you’re looking to transfer large amounts of sequential data - such as video files or virtual machines, the larger 500GB-1TB class SATA SSDs will definitely get the job done more quickly than a low end NVMe drive.
Write Test — Disk Fill
Crucial MX500 500GB
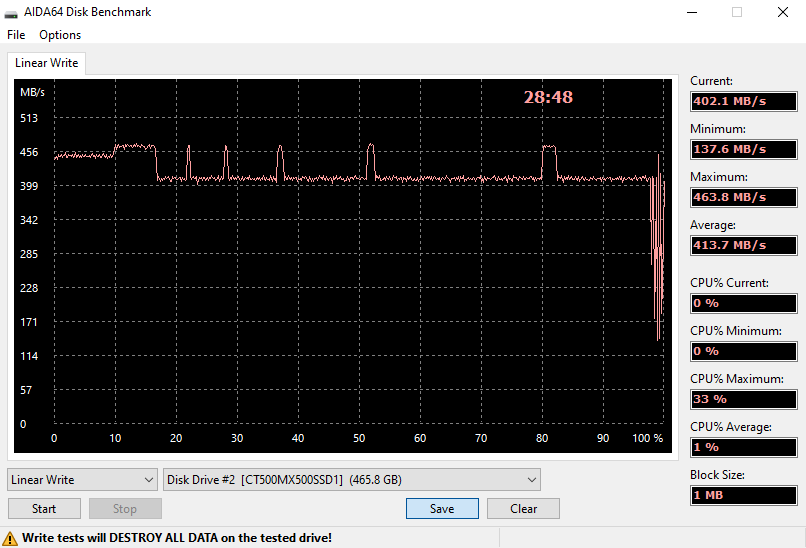 The MX500, which is billed as a midrange drive starts off the disk fill operation around 450MB/s until about 16% of its capacity before settling in for around 400MB/s until the drive is essentially full. At over 95% capacity, the controller starts having a bit of a bad time and performance drops considerably and also becomes a lot less consistent.
Intel 520 180GB
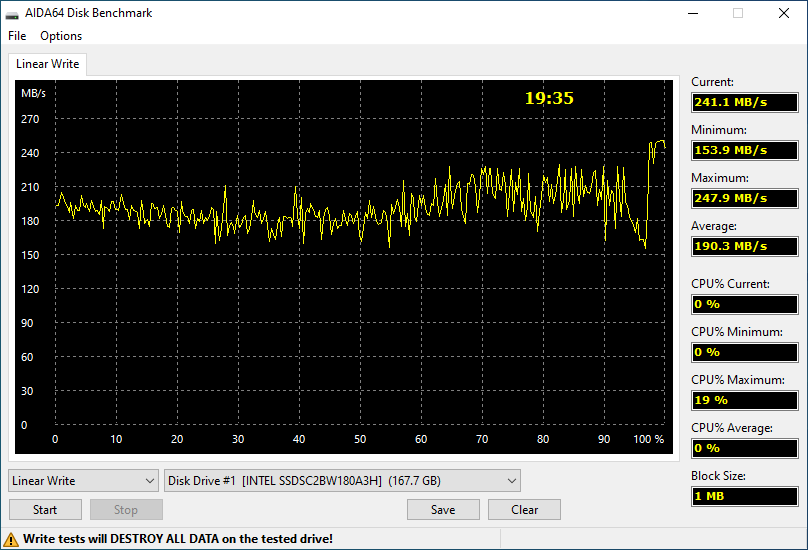 The 180GB Intel 520 is a bit of an odd duck. The 180GB model only populates 6 of the SF-2281 controller’s 8 channels with NAND leading to decreased parallelization compared to the 240GB and larger models resulting in an unimpressive (by today’s standards) 190MB/s average. The older controller architecture is also a bit outmatched providing relatively inconsistent performance.
Samsung 850 EVO 500GB
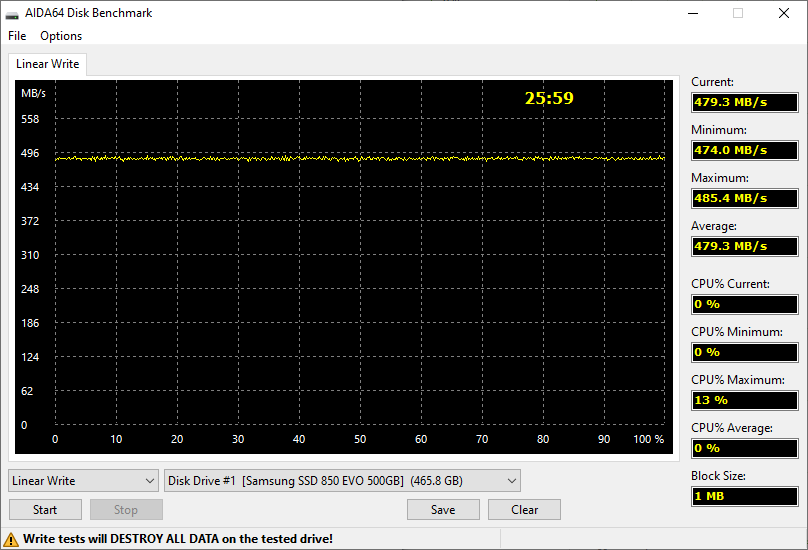 The 500GB 850 EVO delivers rock solid performance across 100% of its addressable capacity at least within the resolution of this test which delivers a nearly unwavering ~480MB/s.
Samsung 860 EVO 1TB
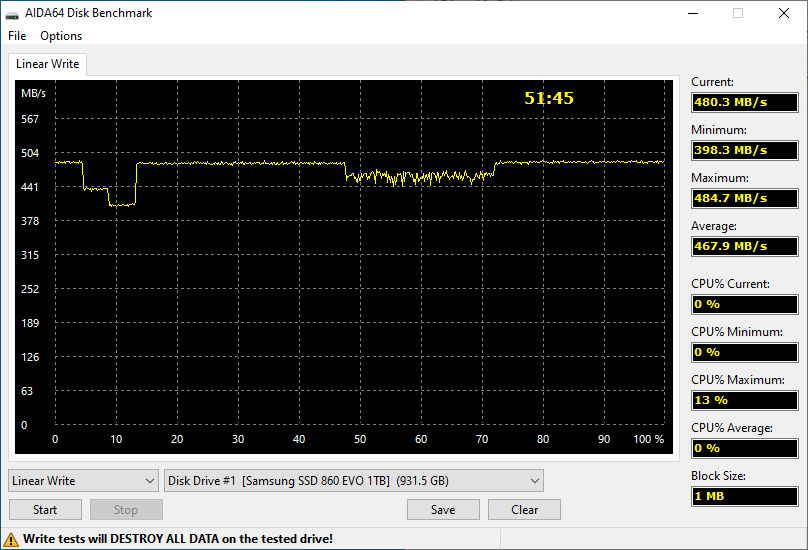 Neither as consistent or as fast as the smaller and older 500GB 850EVO, the 1TB 860 EVO still performs quite well and maintains impressive performance when completely filling the disk.
Samsung PM871b 128GB
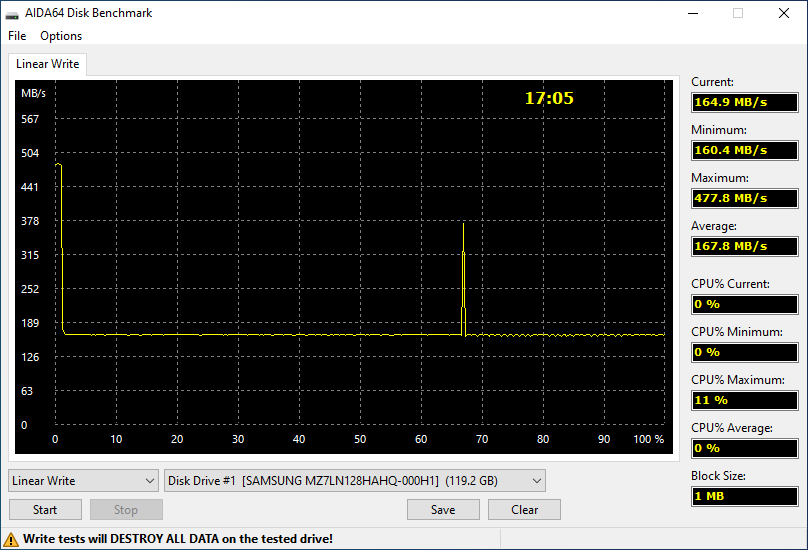 The 128GB PM871b is in a different class than the other drives in this SATA roundup, which shows. After quickly exhausting its SLC cache at a bit under 500MB/s, the drive falls to what seems to be the native TLC write speed which is in the ballpark of 165MB/s. Definitely not a good pick for trying to transfer large amounts of data as quickly as possible.
AS-SSD Sequential Tests
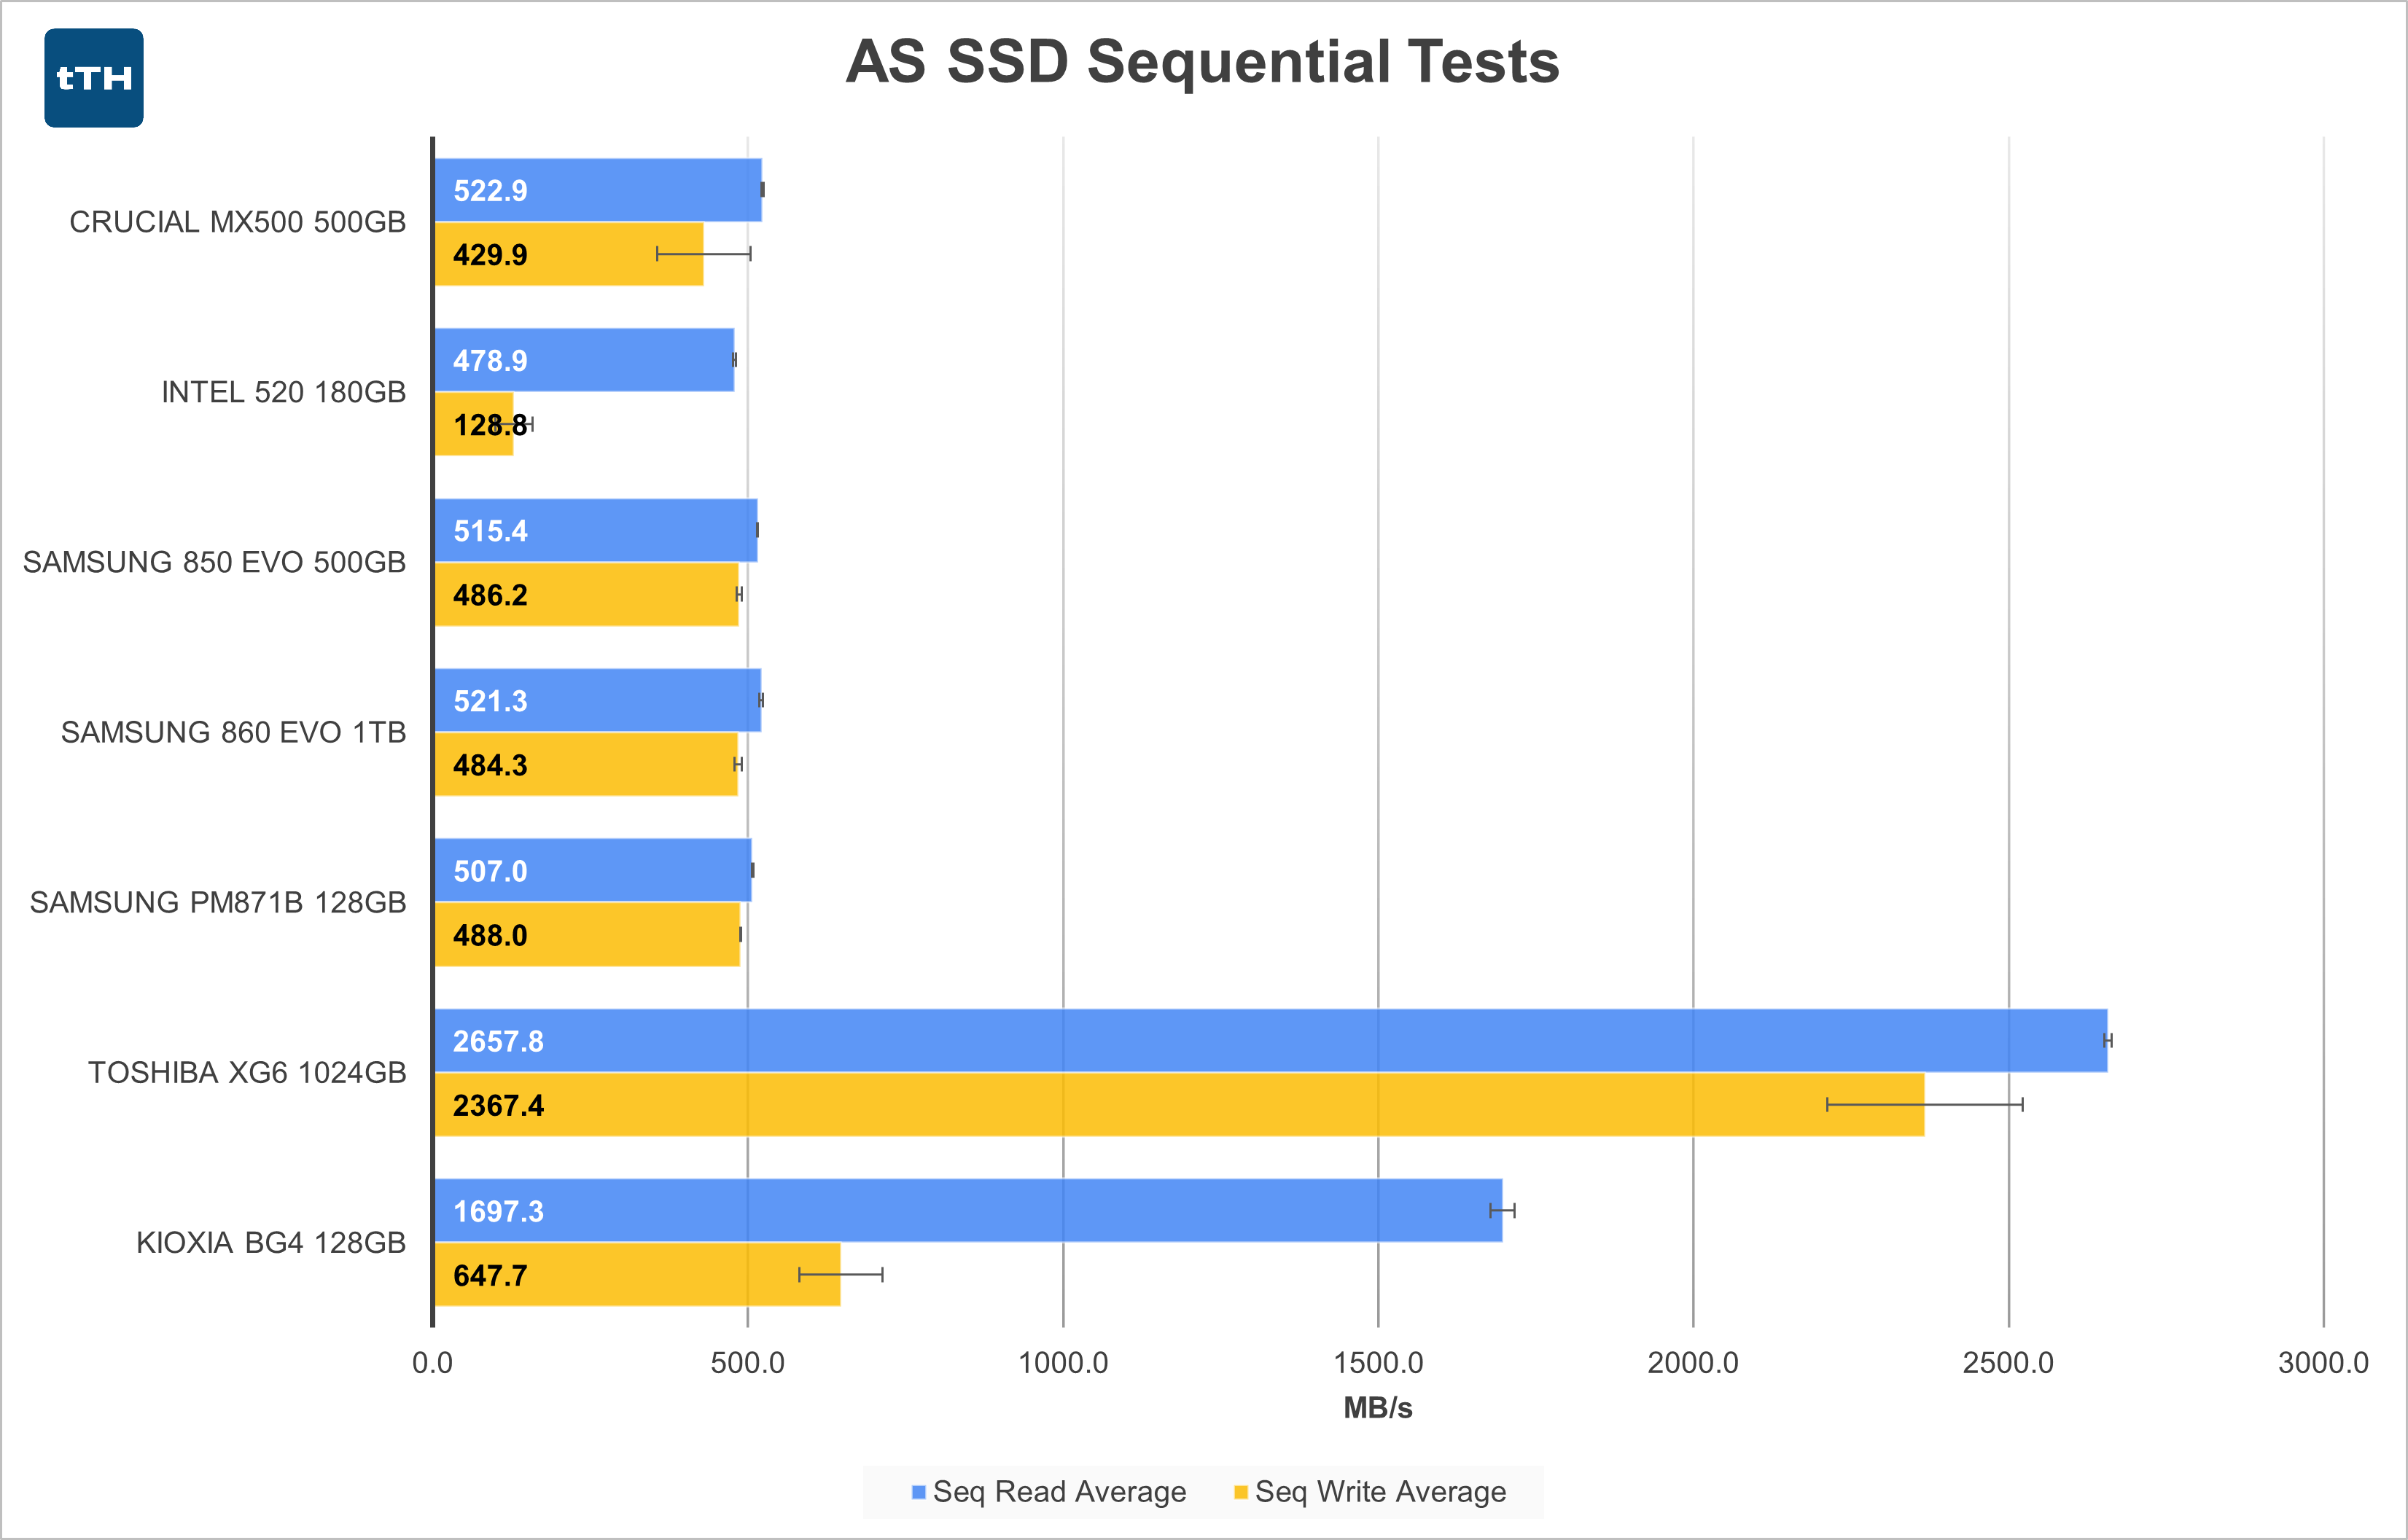 As performed, this test is only writing and then reading 1GB of data, so we’re getting a snapshot of how the drives perform under shorter, more bursty workloads. Here, the peak bandwidth of PCIe can lead to a significant performance advantage on low-end NVMe drives even if in the long term they can’t sustain it. All of the SATA drives – even the 520 – are essentially bumping into the SATA bus’s bandwidth cap for reads, and all but the 520 get moderately close for writes. The MX500’s large standard deviation on the sequential write test is due to a single test run performing abnormally lower than the other four runs.
AS-SSD 4K Tests
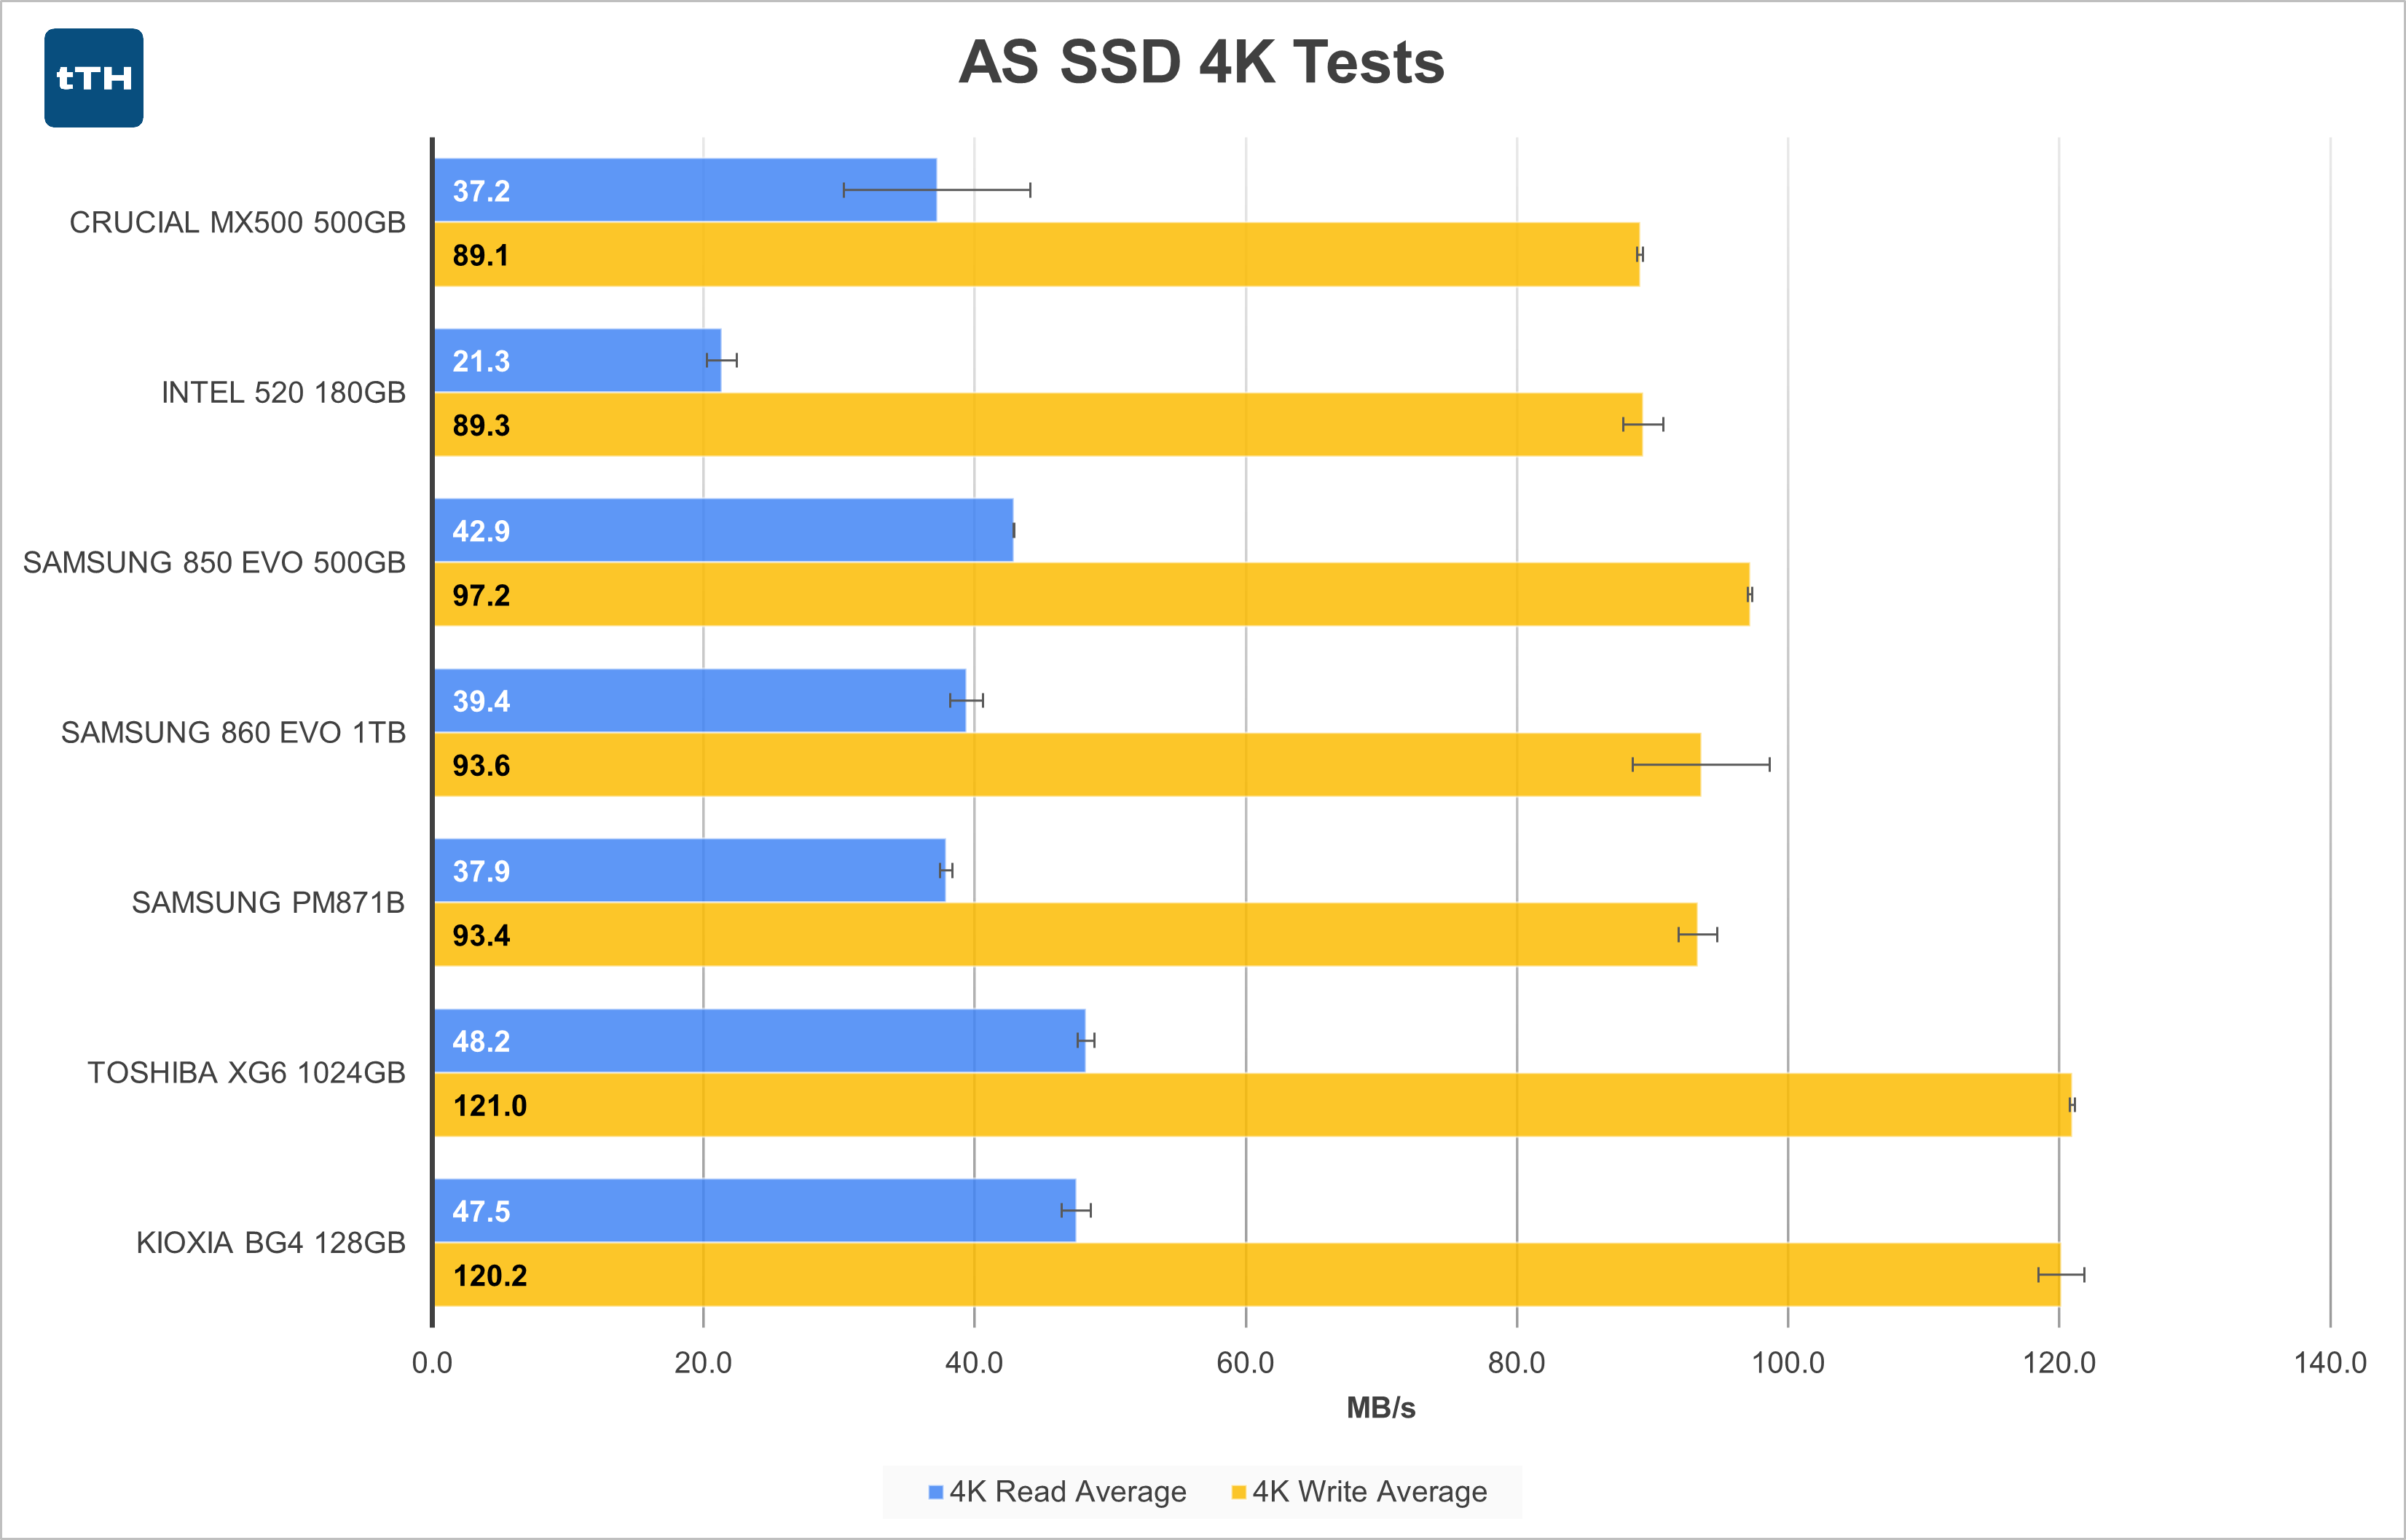 4K Random Performance is heavily influenced by controller design and not by interface bandwidth limits. As such, all the drives tested so far are grouped relatively tightly together, despite the large differences shown in some of the other tests so far. The NVMe drives do pull a bit ahead. The 520 definitely falls behind the pack in 4K Reads, but for such an old drive this isn’t a bad showing. The MX500’s large standard deviation on the 4K read test is due to a single test run performing abnormally lower than the other four runs - notably, this was a different run than the iteration that had slow sequential write performance.
PCMark 8 Storage Test
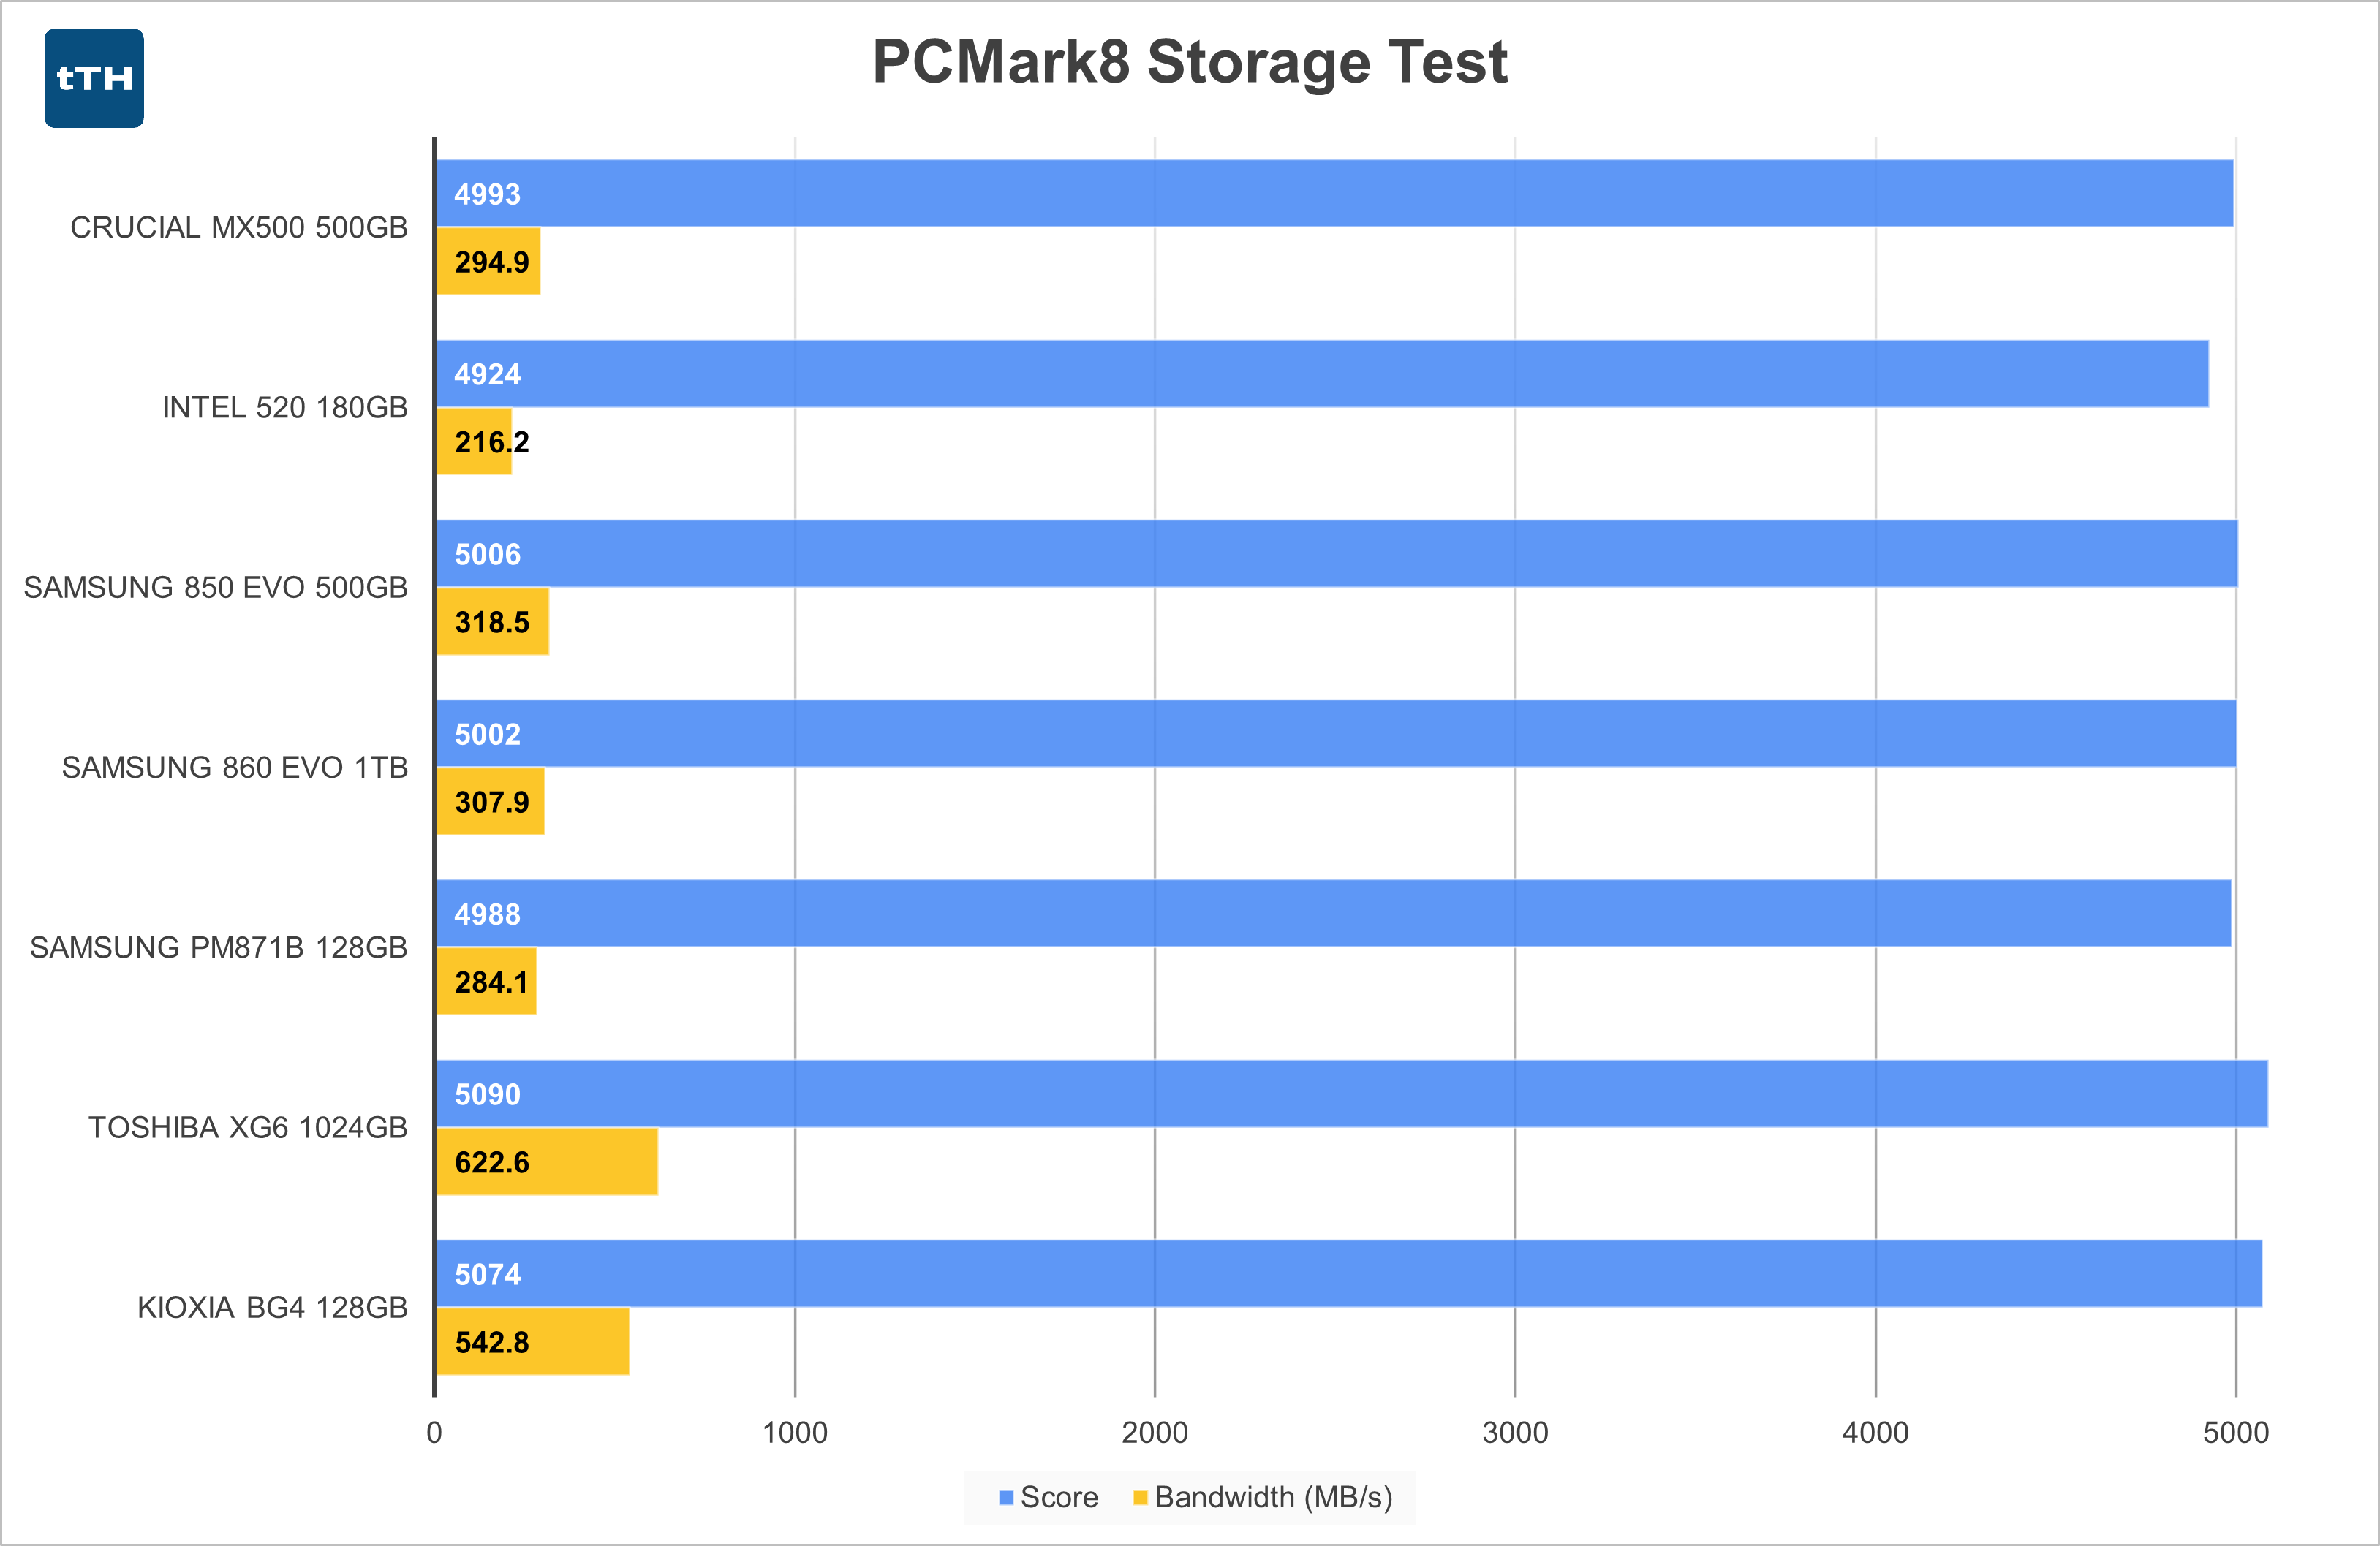 With more datapoints added to my PCMark 8 Storage test library, their scoring system makes even less sense than it initially appeared. Despite the NVMe drives delivering up to 2x the performance of the fastest SATA drive, the reported score (on a dedicated storage test no less) increases by less than 2%. Ignoring the non-sensical unitless score metric, we can see that there’s at least some evidence that even low-end NVMe drives can lead to increased system and application performance. To what extent will probably depend on other factors such as how fast your CPU is and how storage heavy your applications are, but there is definitely a decent differentiation of drives by interface type.
Large-File Transfer Tests
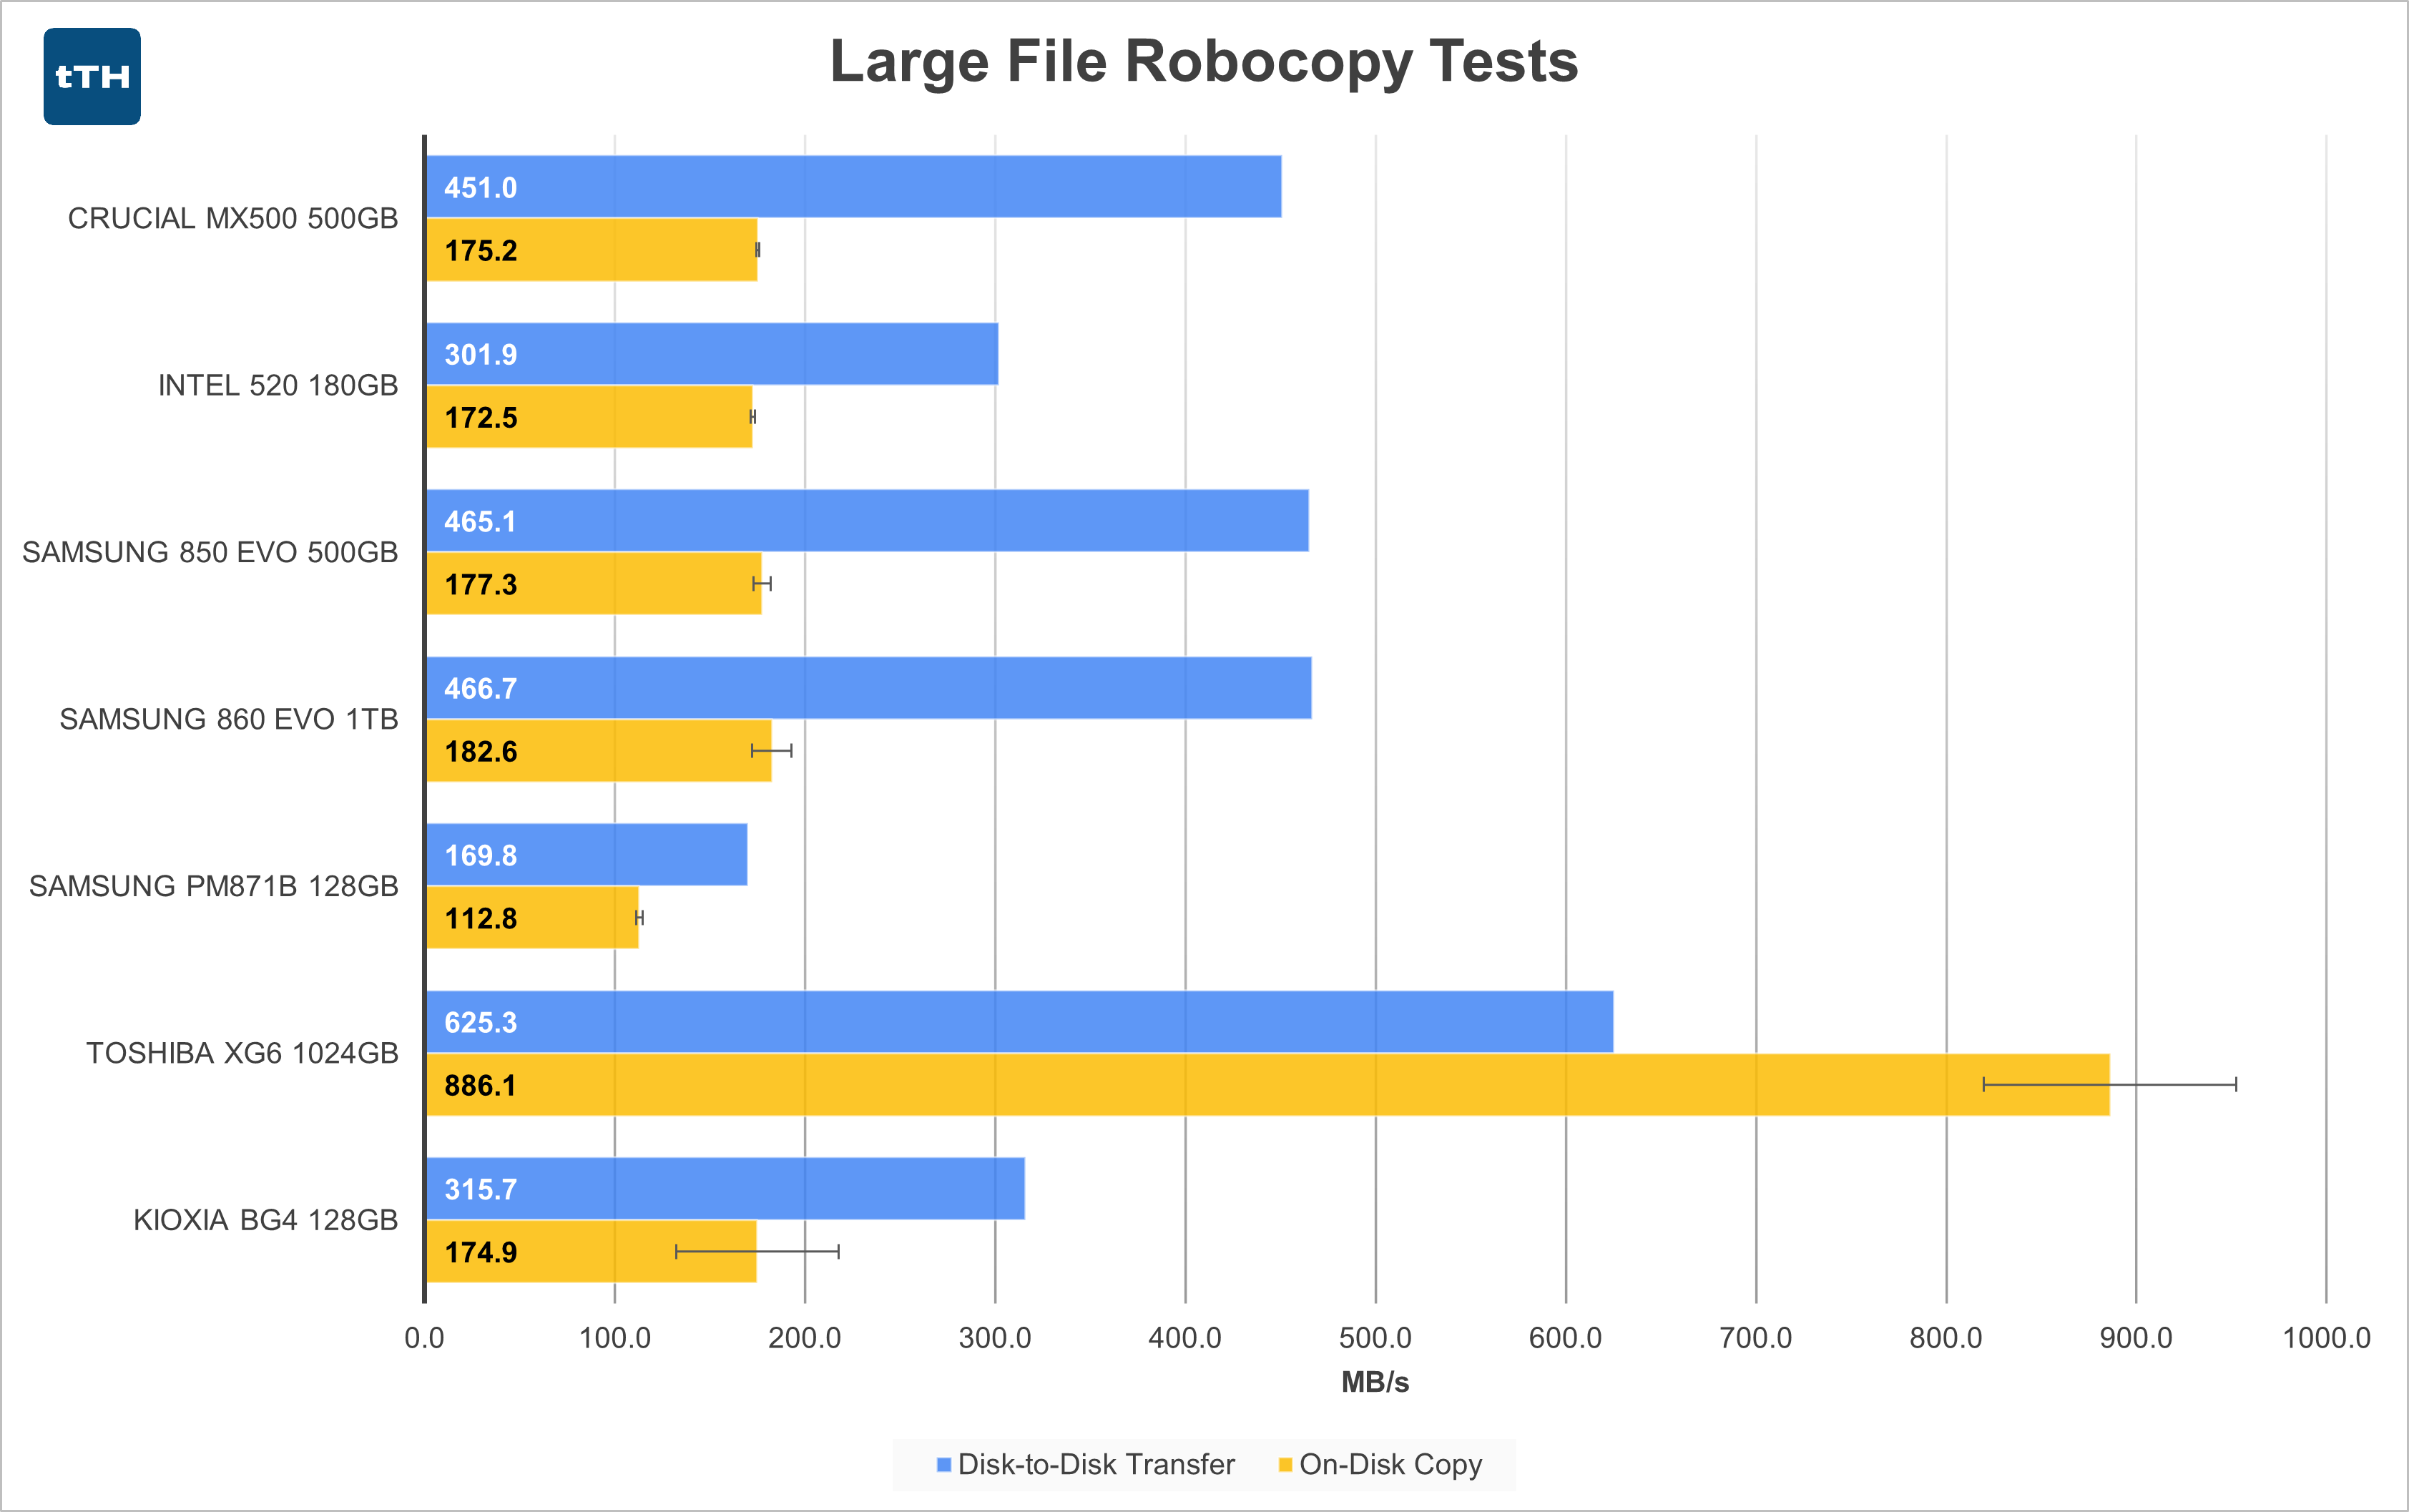 The disk to disk transfer performance largely mirrors the AS-SSD Sequential Write performance on the SATA drives, but things get more interesting for the on-disk copy section.
In this test, one of the differences between SATA and PCIe begins to show itself. PCIe is a bidirectional bus that allows simultaneous transfers in both directions. SATA on the other hand has an aggregate practical transfer limit of up to approximately 500MB/s for combined reads and writes. All of the SATA drives (minus the PM871b) all settle into a narrow band between 170 and 180MB/s for the on-disk copy. Theoretically, the drives would be limited to simultaneous ~250MB/s Read and ~250MB/s Write, but due to overhead for controller and disk busy time, the result ends up at a slightly lower net copy speed, despite the drives being able to deliver significantly higher performance when performing just reads or just writes.
As this is a longer test that significantly exceeds the size of the PM871b’s SLC cache, its performance suffers compared to the other drives including the Intel 520. Despite the 128GB BG4 having access to significantly higher bandwidth, the controller and NAND aren’t able to saturate the available throughput.
In case the disk-to-disk transfer numbers look a bit odd for the XG6, recall that this test is a mostly sequential 30GB transfer from a read-source that peaks at 750MB/s due to the limitations of my testbed. Unlike the 128GB drives that mostly don’t even peak at (let alone sustain) over 750MB/s, the XG6 is severely bottlenecked during the copy portion of this test as it can write at significantly greater than 750MB/s. Despite the bottleneck, the XG6 still compares quite favorably to the other drives.
Small-File Transfer Tests
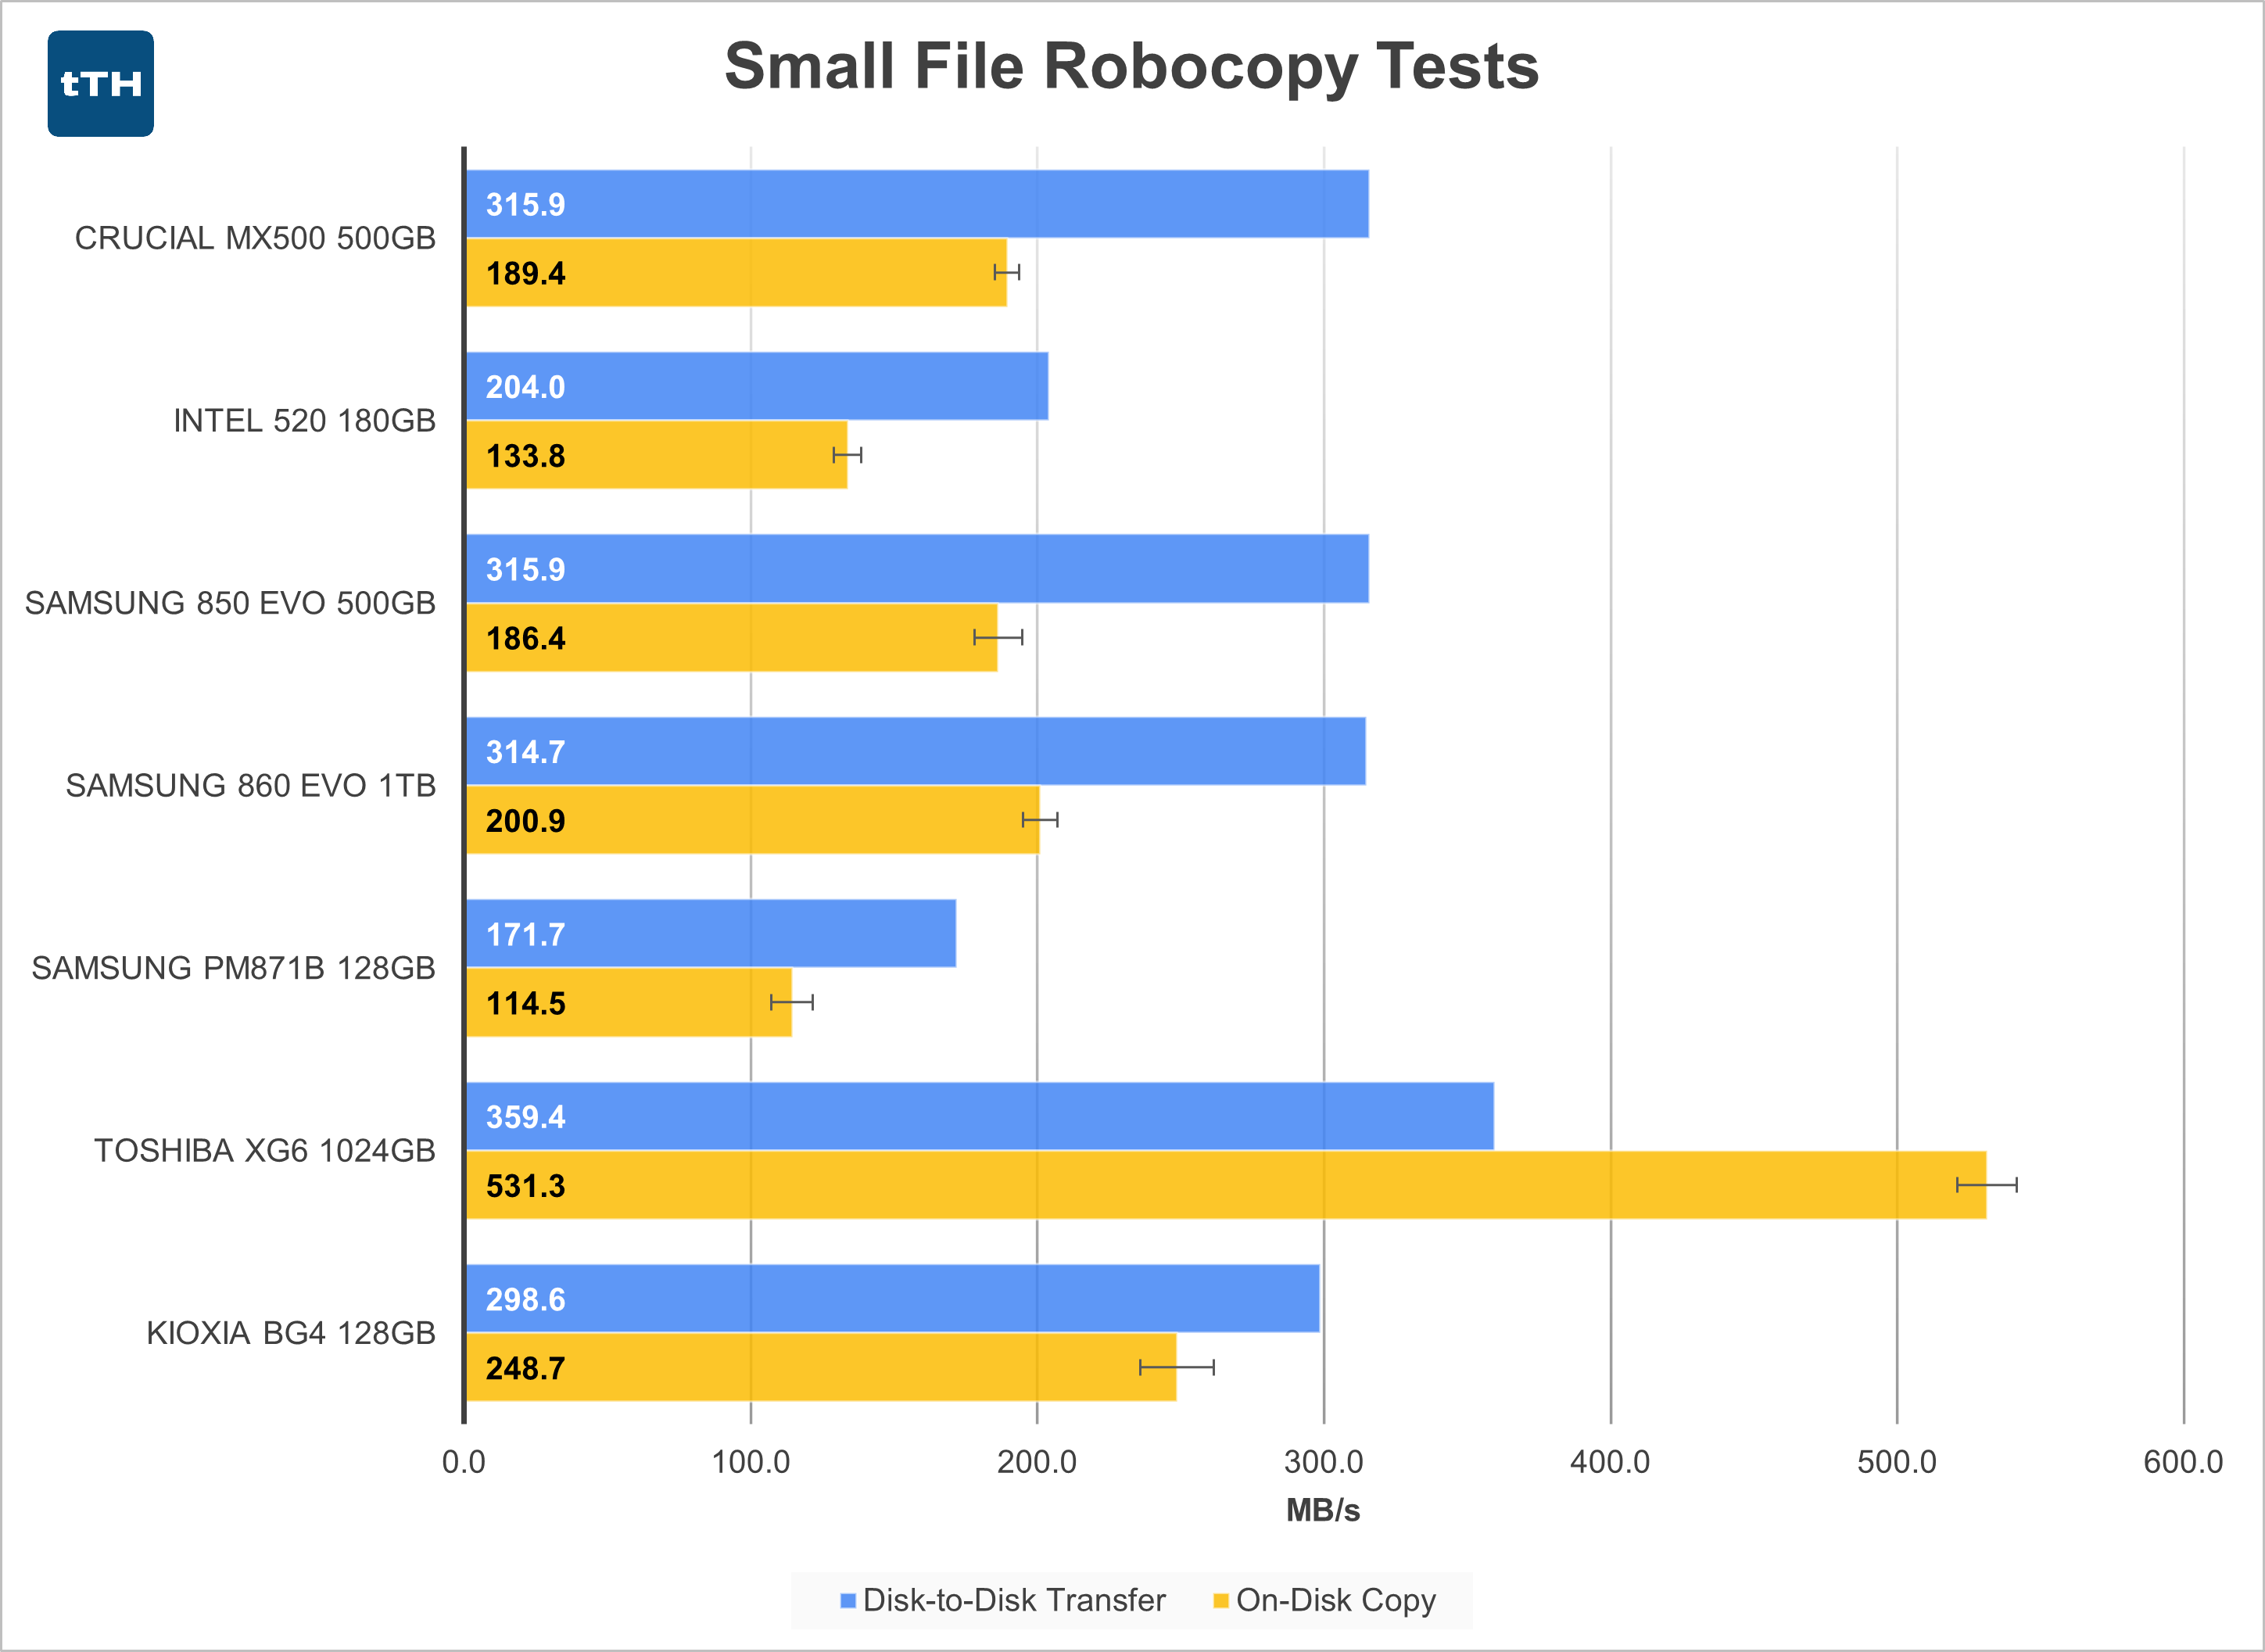 In the small-file tests, all of the SATA drives except the PM871b see decreased performance on the disk-to-disk transfer. The PM871b sees an insubstantial increase in this metric yet continues to trail the rest of the pack by a significant margin. For on-disk copy performance, the MX500, 850 EVO, 860 EVO, and even the PM871b see slight improvements in performance likely due to this test being shorter than the large-file test and thus proportionally more writes fitting in the drives’ SLC caches. Even still, all of the SATA drives are outclassed by the two NVMe drives.
Conclusion
SATA and PCIe NVMe drives are definitely different beasts. The former standard is arguably on its way out while the latter continues to evolve. Still, newer doesn’t always mean better – at least not for all use-cases. There’s definitely a case for using NVMe drives for OS/Application duty as it would seem that even entry-level PCIe drives provide at least marginally better application performance. That said, for large-file transfers a SATA drive can still provide better performance when compared to entry level NVMe drives.
Just make sure that if you’re on a budget that you’re balancing price, capacity, and performance for your desired workload as NVMe drives still generally cost more per GB than SATA drives. Buying the fastest, most expensive NVMe drive may not improve your performance by very much and could potentially leave you with less space than a less expensive SATA SSD. Alternatively, you may be better off spending that premium on other system components like more RAM or a faster CPU.
The same can be said about the differentiation between different SATA drives. Samsung commands a reasonable price premium among SATA drives, which isn’t entirely undeserved. Their drives do tend to offer class-leading performance, though in many cases their lead isn’t substantial. Based on the tests in this review, one of the things that Samsung seems to excel with in the 850 EVO and 860 EVO series is their run-to-run consistency. On the flip side, I was a bit surprised to see how the MX500 was a bit inconsistent from run-to-run.
If you’re looking to pick up a cheap drive, looking at the Intel 520 vs the Samsung PM871b shows you what you get for similar amounts of money by going with either an older drive or a newer low-end drive. These drives really behave pretty differently depending on what you’re doing with them, and due to them each underperforming in at least one metric you’ll want to carefully consider your use-case for the drive so that you don’t end up disappointed with a drive that doesn’t really suit your needs. For example, the Intel 520 would likely perform better for copying large files between computers whereas the PM871b would likely perform better as an OS/Application drive.
The story with the larger SATA drives is also a bit of a mixed bag. The group tested all show higher and more consistent performance than the smaller SATA drives. That said, the relatively inexpensive SATA 1TB MX500 is currently selling for around $95 which isn’t much less than a $110 NVMe 1TB WD Blue SN550 (post coming soon). Spoiler alert: the SN550 should wipe the floor with the MX500 in basically every performance metric. A 1TB 860 EVO costs even more at around $115. Of course there are far less expensive drives available than the Samsungs, Crucials, and Western Digitals of the world, but these are the drives I’ve happened to spend my hard earned money on and have available to test (I do have a few more SATA SSD models that include other vendors, but they’re in systems where I can’t easily swap out the drives).
I’m curious to see if the SATA SSD industry continues to run on intertia for a few more years, if we see mild iterations using newer generations of NAND, or if we’ll start to see some of the higher-end and midrange devices start to disappear as SATA is relegated to the race-to-the-bottom bargain-bin and entry-level NVMe drives take their place. Whatever happens, I’m glad to be along for the ride.