Intel 660p 1024GB Review - Quality, Questionable, or Quiet Progress?
A review of the 1024GB Intel 660p M.2 PCIe NVMe SSD Using Testbed v1.0 and Methodology v1.0.
QLC NAND is a tricky beast. The enthusiast community is up in arms about it as a terrible development. The manufacturers in the industry are calling it the next logical step in what has been a long and winding road of progress over the years in NAND technology. QLC is short for Quad Level Cell. In a vacuum this won’t mean much, and if you don’t already know what the term means, getting into it here would distract from the drive review at hand. Thankfully, I just published a separate piece that goes into QLC and all the previous iterations in my SSD Terminology Overview Part 2 - NAND Technologies piece.
Intel has a storied history of alternatingly buildng SSDs with in-house controllers as well as 3rd party controllers, first from SandForce and now from SMI. The 660p is a follow up of the 600p which used an 3D TLC and SMI PCIe controller, but generally underperformed for its market segment.
Since Intel released the 660p in 2018, this review is clearly not intended to be used for buying advice, unless it is for old or second-hand drives. The 660p has already been succeeded by two newer generations of QLC drives: the 665p which brought 96-layer 3D QLC and minor performance improvements, more recently the 670p that ups the ante with 144-layer 3D QLC and supposedly a newer controller, but I haven’t been able to find further details.
Before I get too far, if you want to know more about how I perform the tests in this review, check out my first blog post: SSD Review Background, Setup, and Methodology v1.0. My first round of reviews will all use the same Testbed and Methodology, so will be directly comparable.
The Drive:
Intel 660p 1024GB
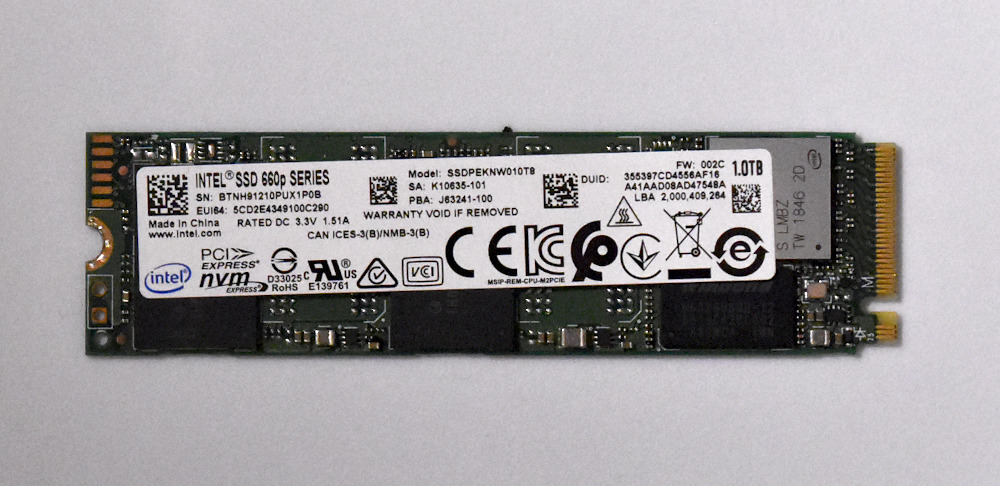 Intel uses an SMI SM2263 controller paired with a full 1GB DRAM cache and 1TB of Intel QLC NAND. This drive is similar to the Crucial P1, though notably the P1 uses half as much DRAM.
| The Drive - Table of Specifications | |
|---|---|
| Intel 660p | |
| M.2 Dimensions | 2280 |
| Capacity | 1024GB |
| Interface | PCIe 3.0 x4 |
| NVMe Protocol | 1.3 |
| Seq Read | 1800 MB/s |
| Seq Write | 1800 MB/s |
| I/O Read | 150K |
| I/O Write | 220K |
| Active Power | 0.1W* |
| Idle Power | 40mW |
| Components | SMI Controller + 1GB DRAM Cache + 2 NAND Packages |
| NAND | Intel 64-layer 1024Gb 3D QLC |
| Rated Endurance | 200TBW |
| Retail/OEM Drive | Retail |
| Cost Today | ~$95 on eBay |
Review
For this review I’ll be comparing the 1TB Intel 660p to the 1TB Toshiba XG6, 1TB WD SN550, 1TB Samsung 860 EVO, 128GB Kioxia BG4, and 128GB Samsung P871b. The XG6 represents a relatively high performance PCIe 3.0 NVMe SSD, the SN550 represents a several year newer low-end competitor to the 660p, the 860 EVO represents high performance SATA SSDs, and the BG4 and PM871b represent low-end PCIe and SATA drives, respectively. If you’d like to compare the results to other drives I’ve tested, the numbers in this review are directly comparable to any of my other reviews with the “Methodology-v1” and “Testbed-v1” tags.
In case you didn’t catch my note at the top, if you’d like to know more about my hardware setup as well as my testing methodology, check out my SSD Review Background, Setup, and Methodology v1.0 piece.
Write Test — Disk Fill Summary
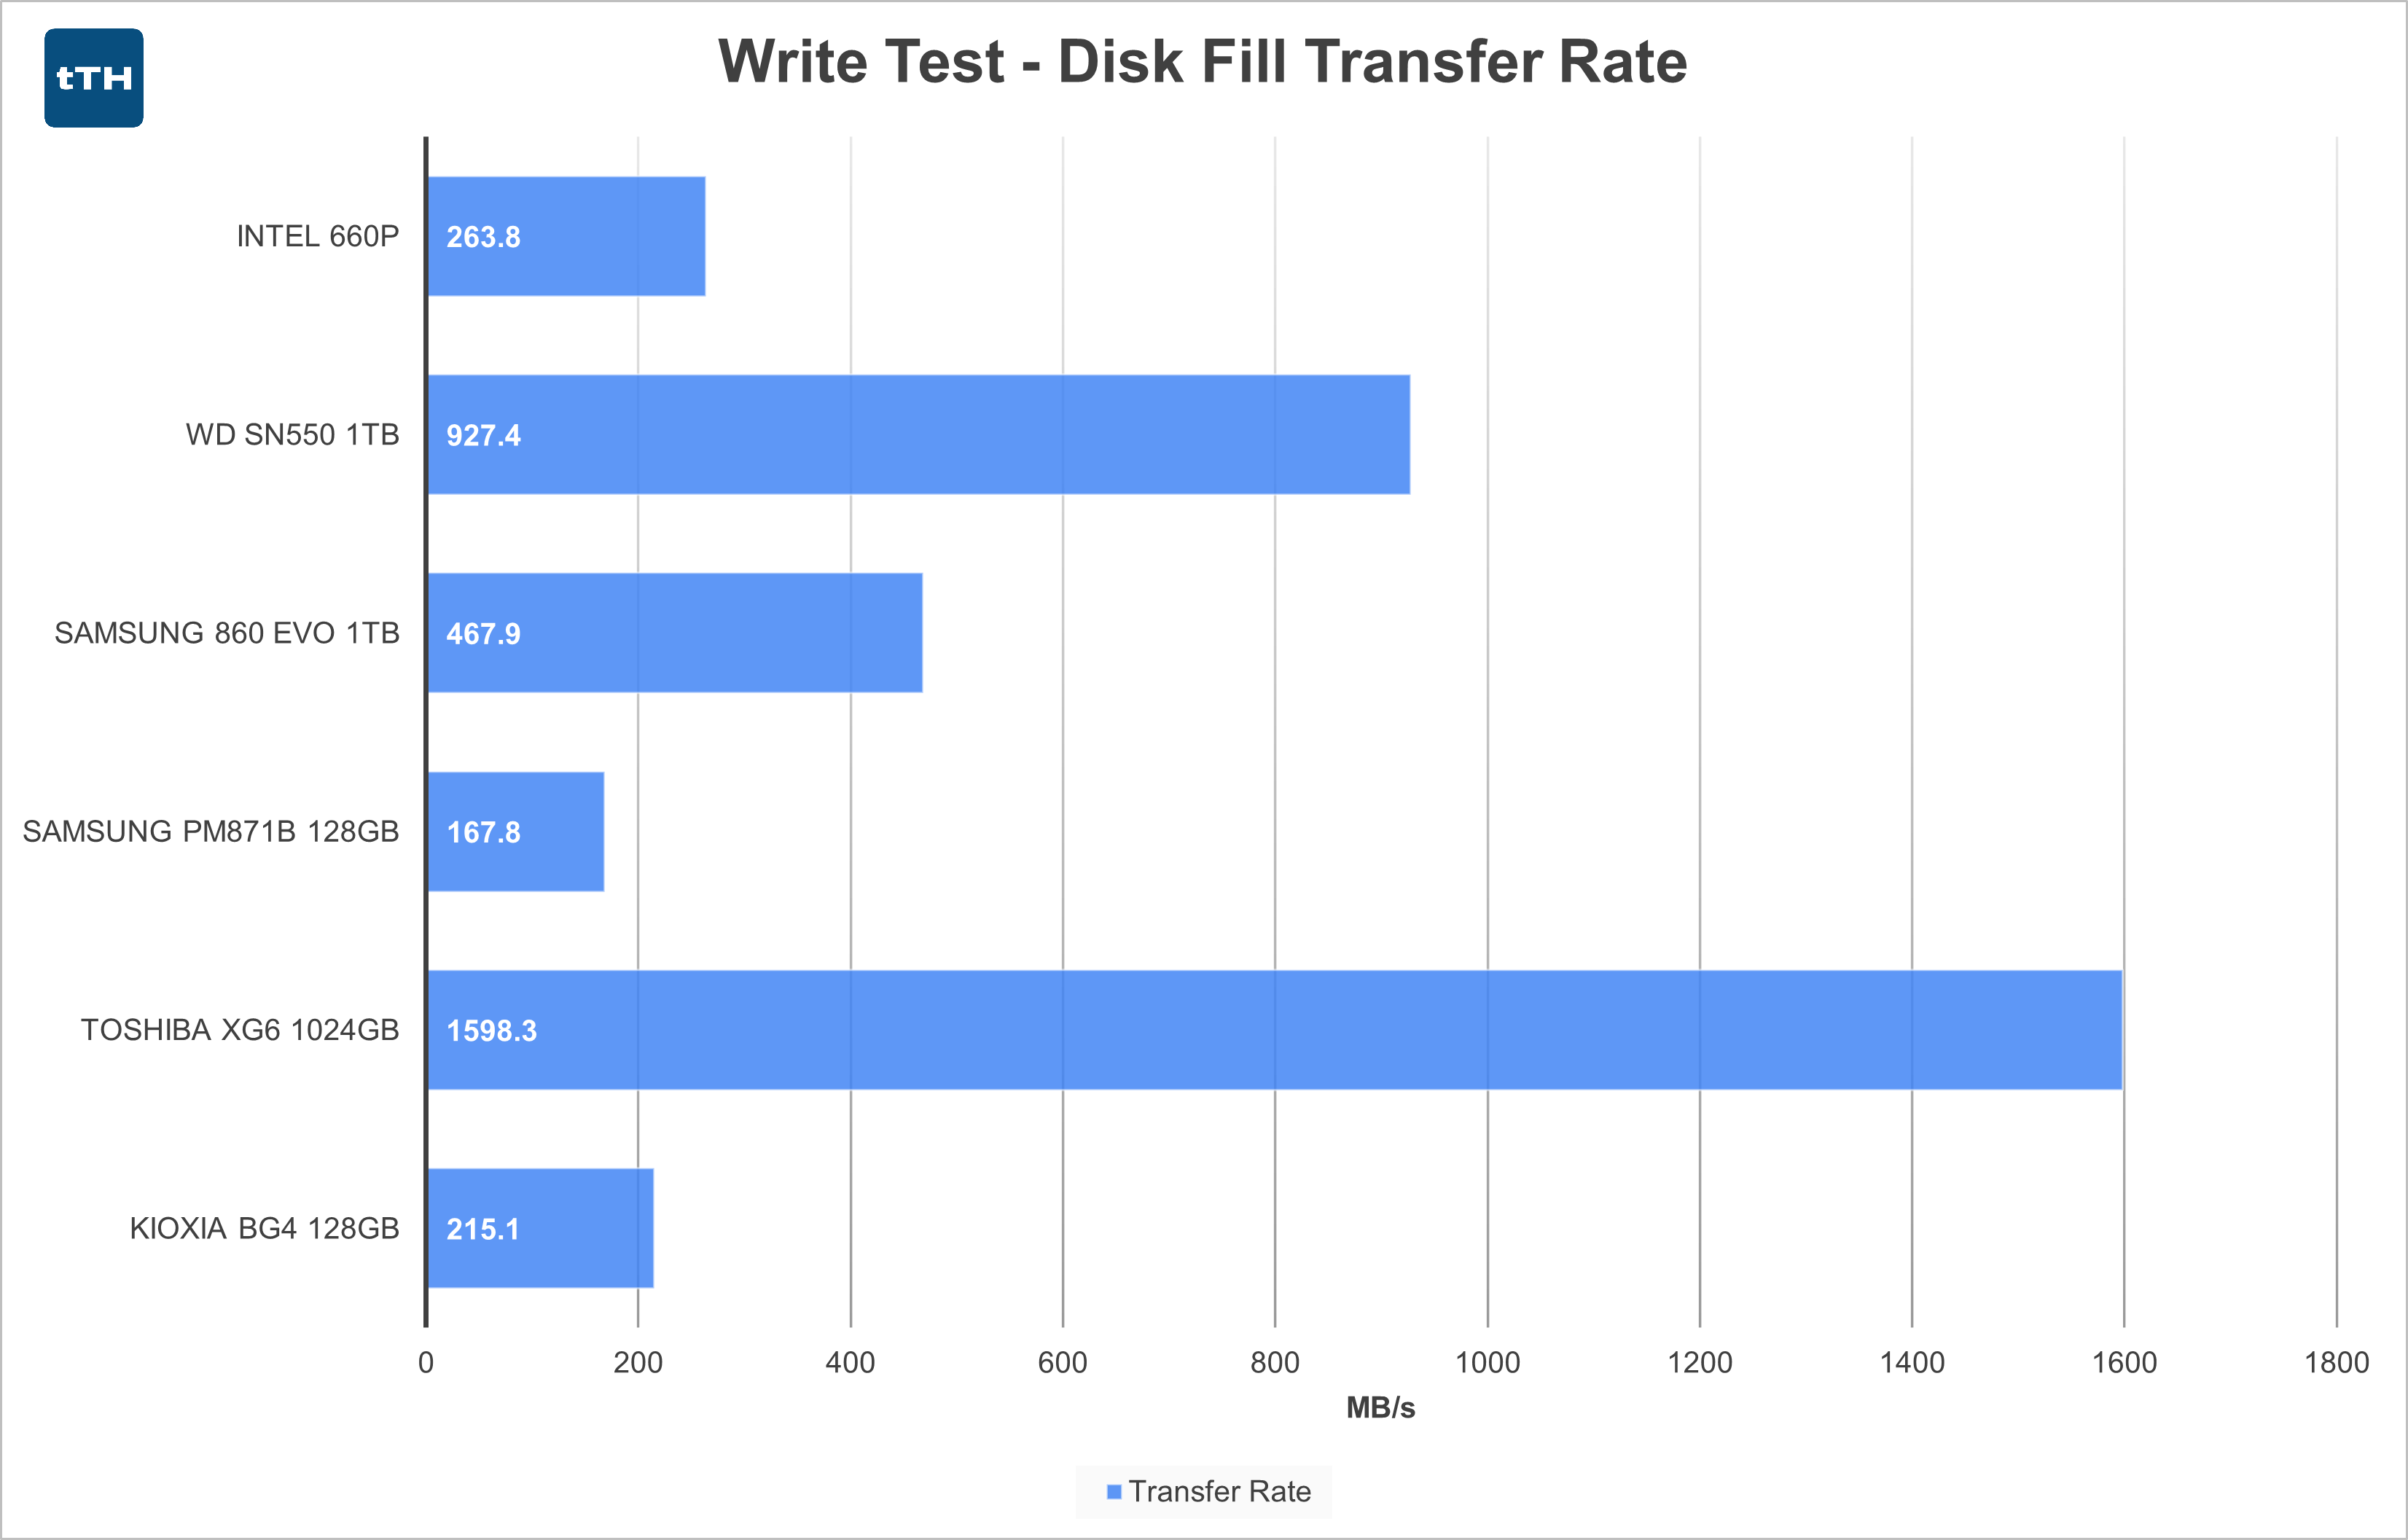
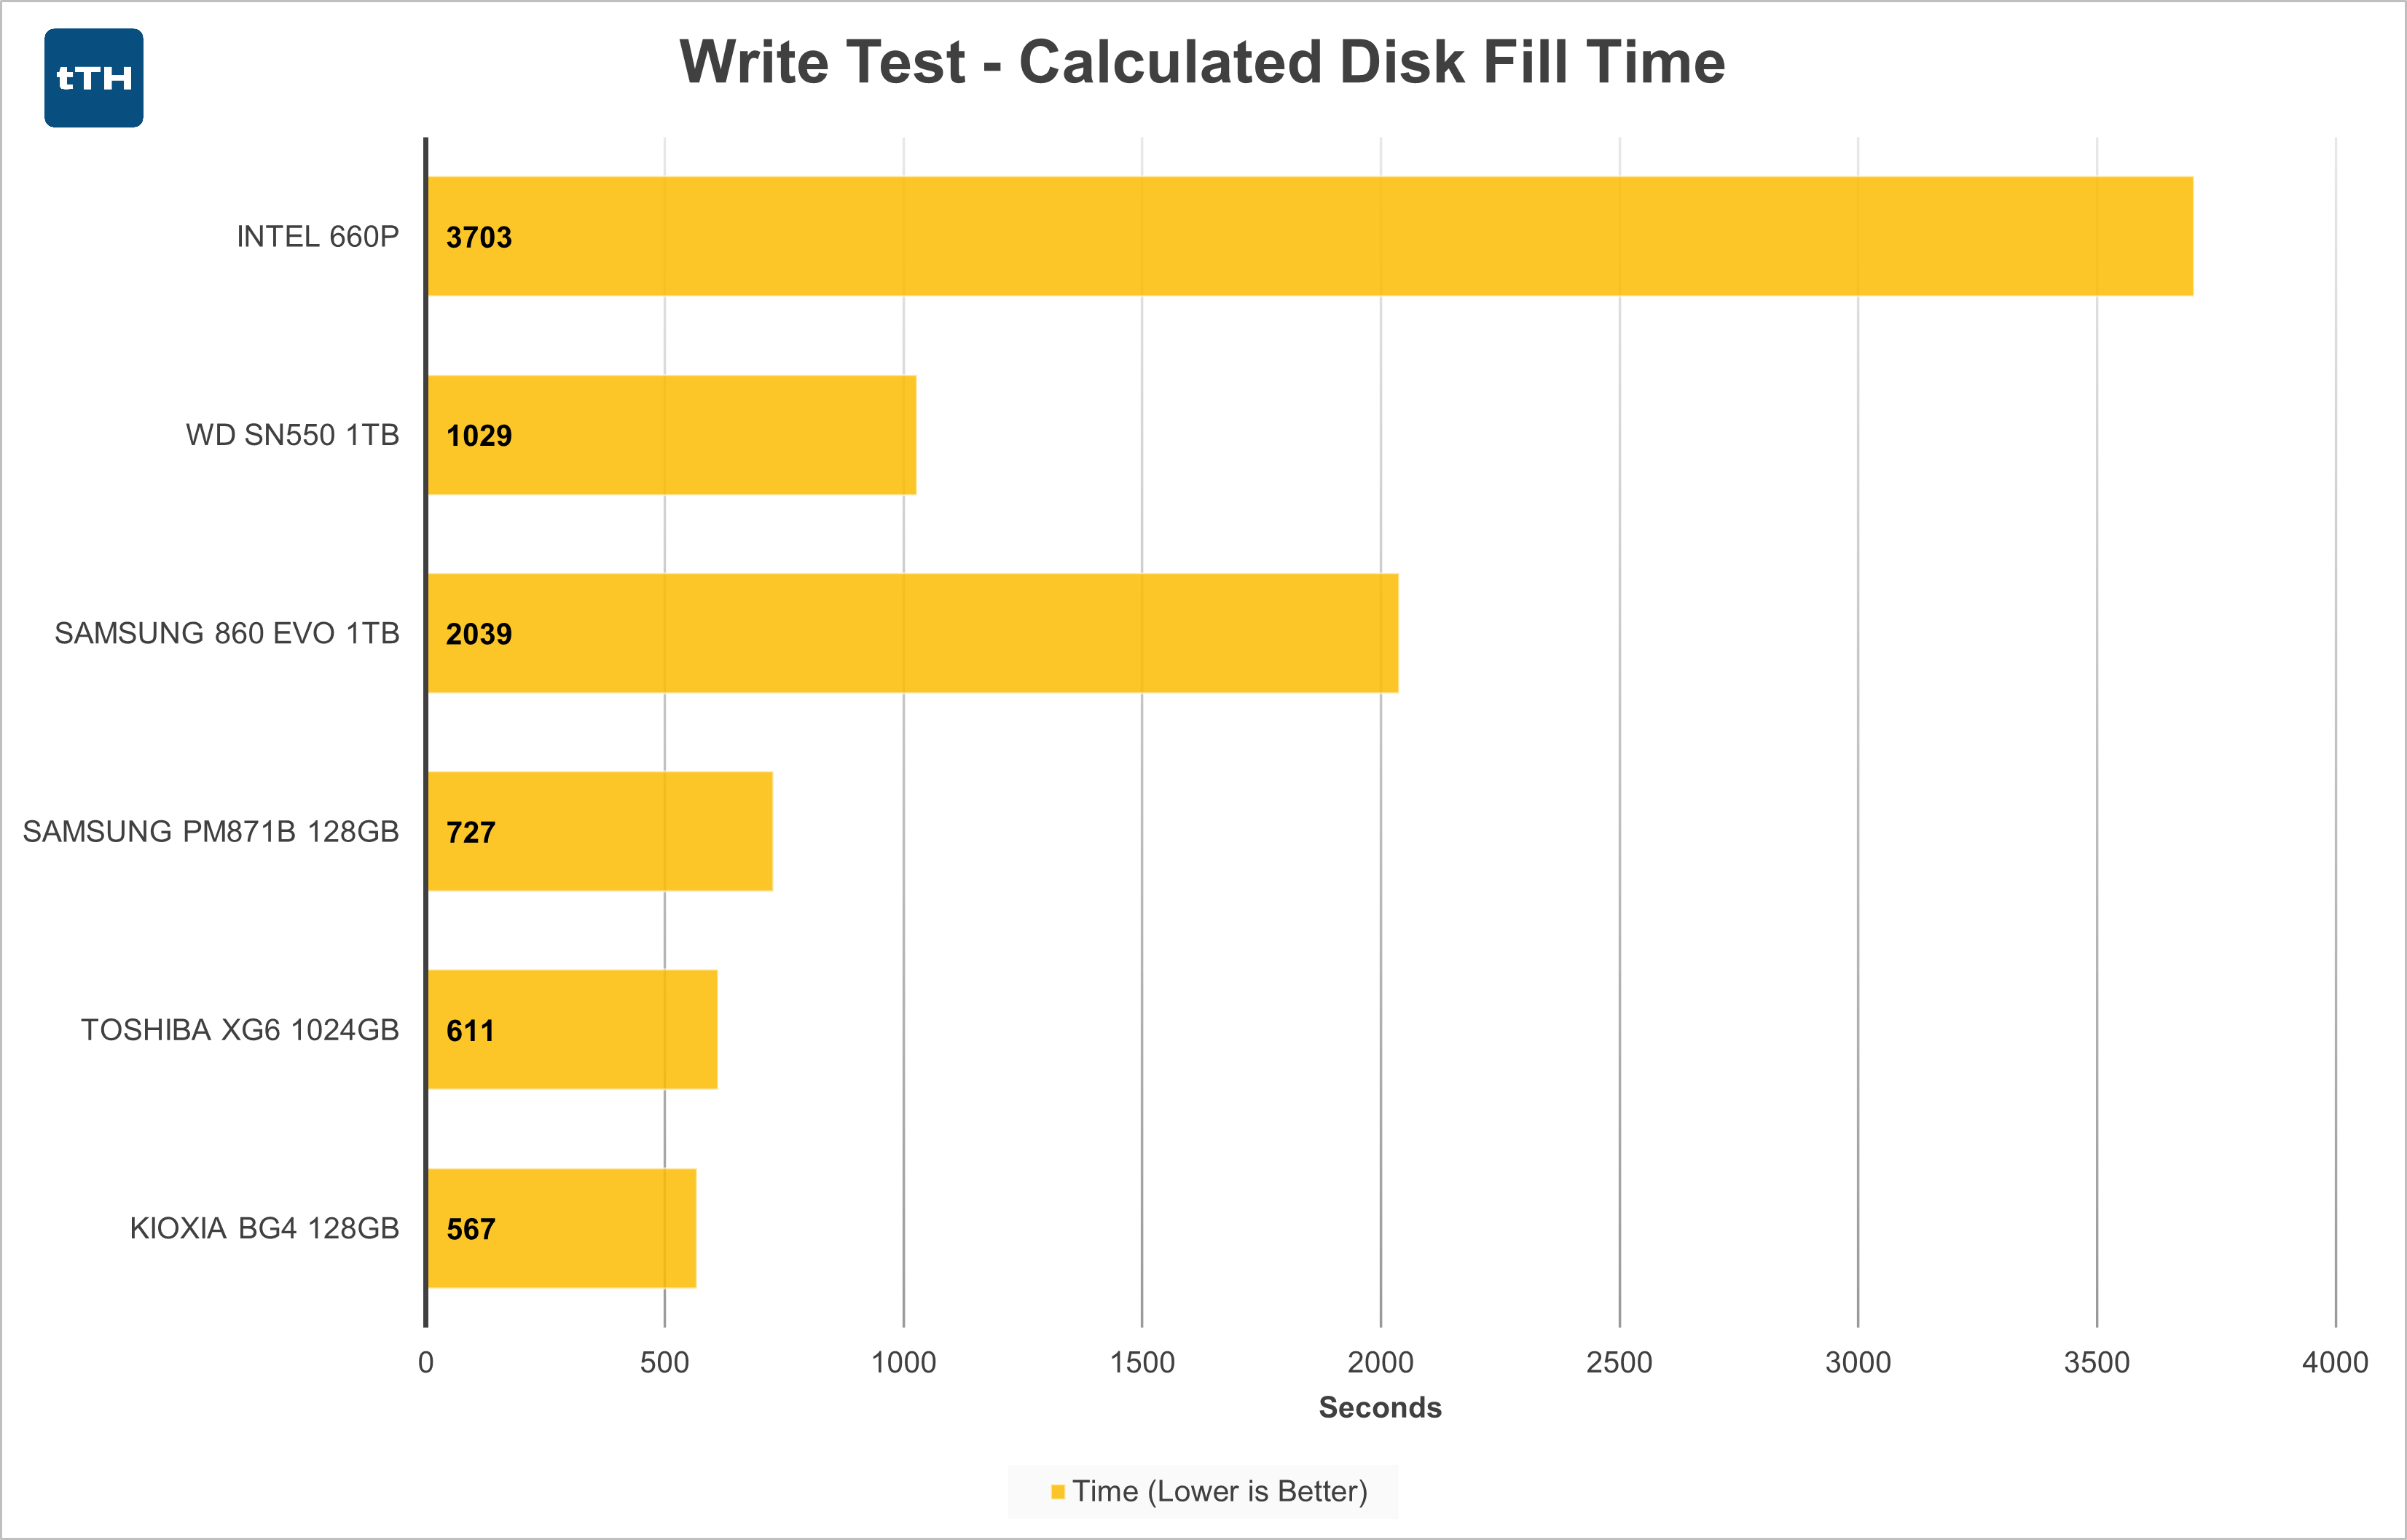 The 660p immediately takes a back-stage to the higher performing drives when it comes to disk-fill transfer rate. It underperforms all of the other drives in the roundup except for the 128GB drives that lack the benefit of controllers fully populated with NAND. At least in this metric, simply having a PCIe interface instead of a slower SATA interface isn’t a determining factor. Disk fill times are pretty horrendous, taking just over an hour to write 1TB of data to the drive.
With performance this low, is the 660p a complete no-go even for light consumer usage? The graph in the next section starts to paint a better picture of what’s going on.
Write Test — Disk Fill
Intel 660p 1024GB
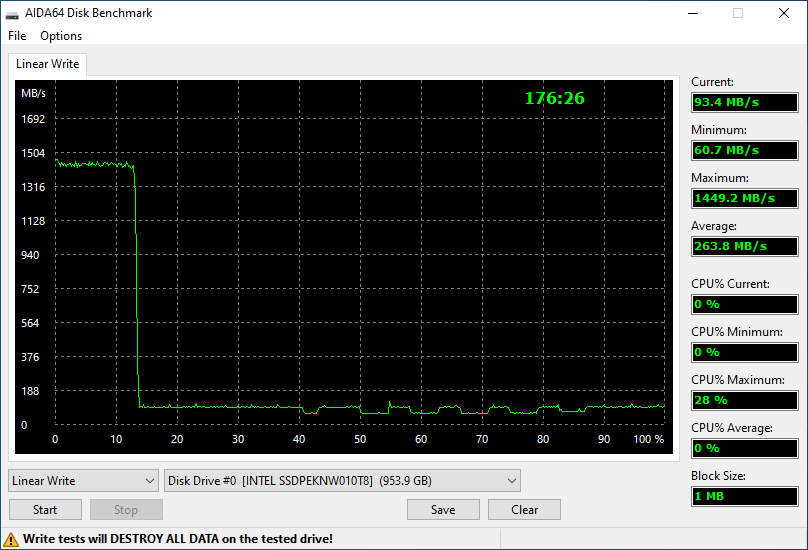 When looking at how the 660p’s write performance varies as the drive fills we see that the drive begins the test at a perfectly respectable ~1400MB/s. For this portion of the test the drive far exceeds what even the fastest SATA drives can muster. Under constant sustained writes, performance seems to fall off around the 120-140GB mark, which aligns with the drive’s variable SLC cache of 140GB (when empty) to 12GB (when full) as specified by Intel. This is particularly important because as the drive fills with static data such as an OS and applications, there will be less and less SLC cache for future writes.
Unfortunately, once the SLC cache is filled, the drive’s performance falls off of a cliff and drops well below 100MB/s with further intermittent drops as slow as 60MB/s – which is bad by even spinning-disk standards. As this is the performance level for over 80% of the drive’s capacity, it makes sense that total disk-fill time is so long despite entirely acceptable performance at the beginning of the test.
AS-SSD Sequential Tests
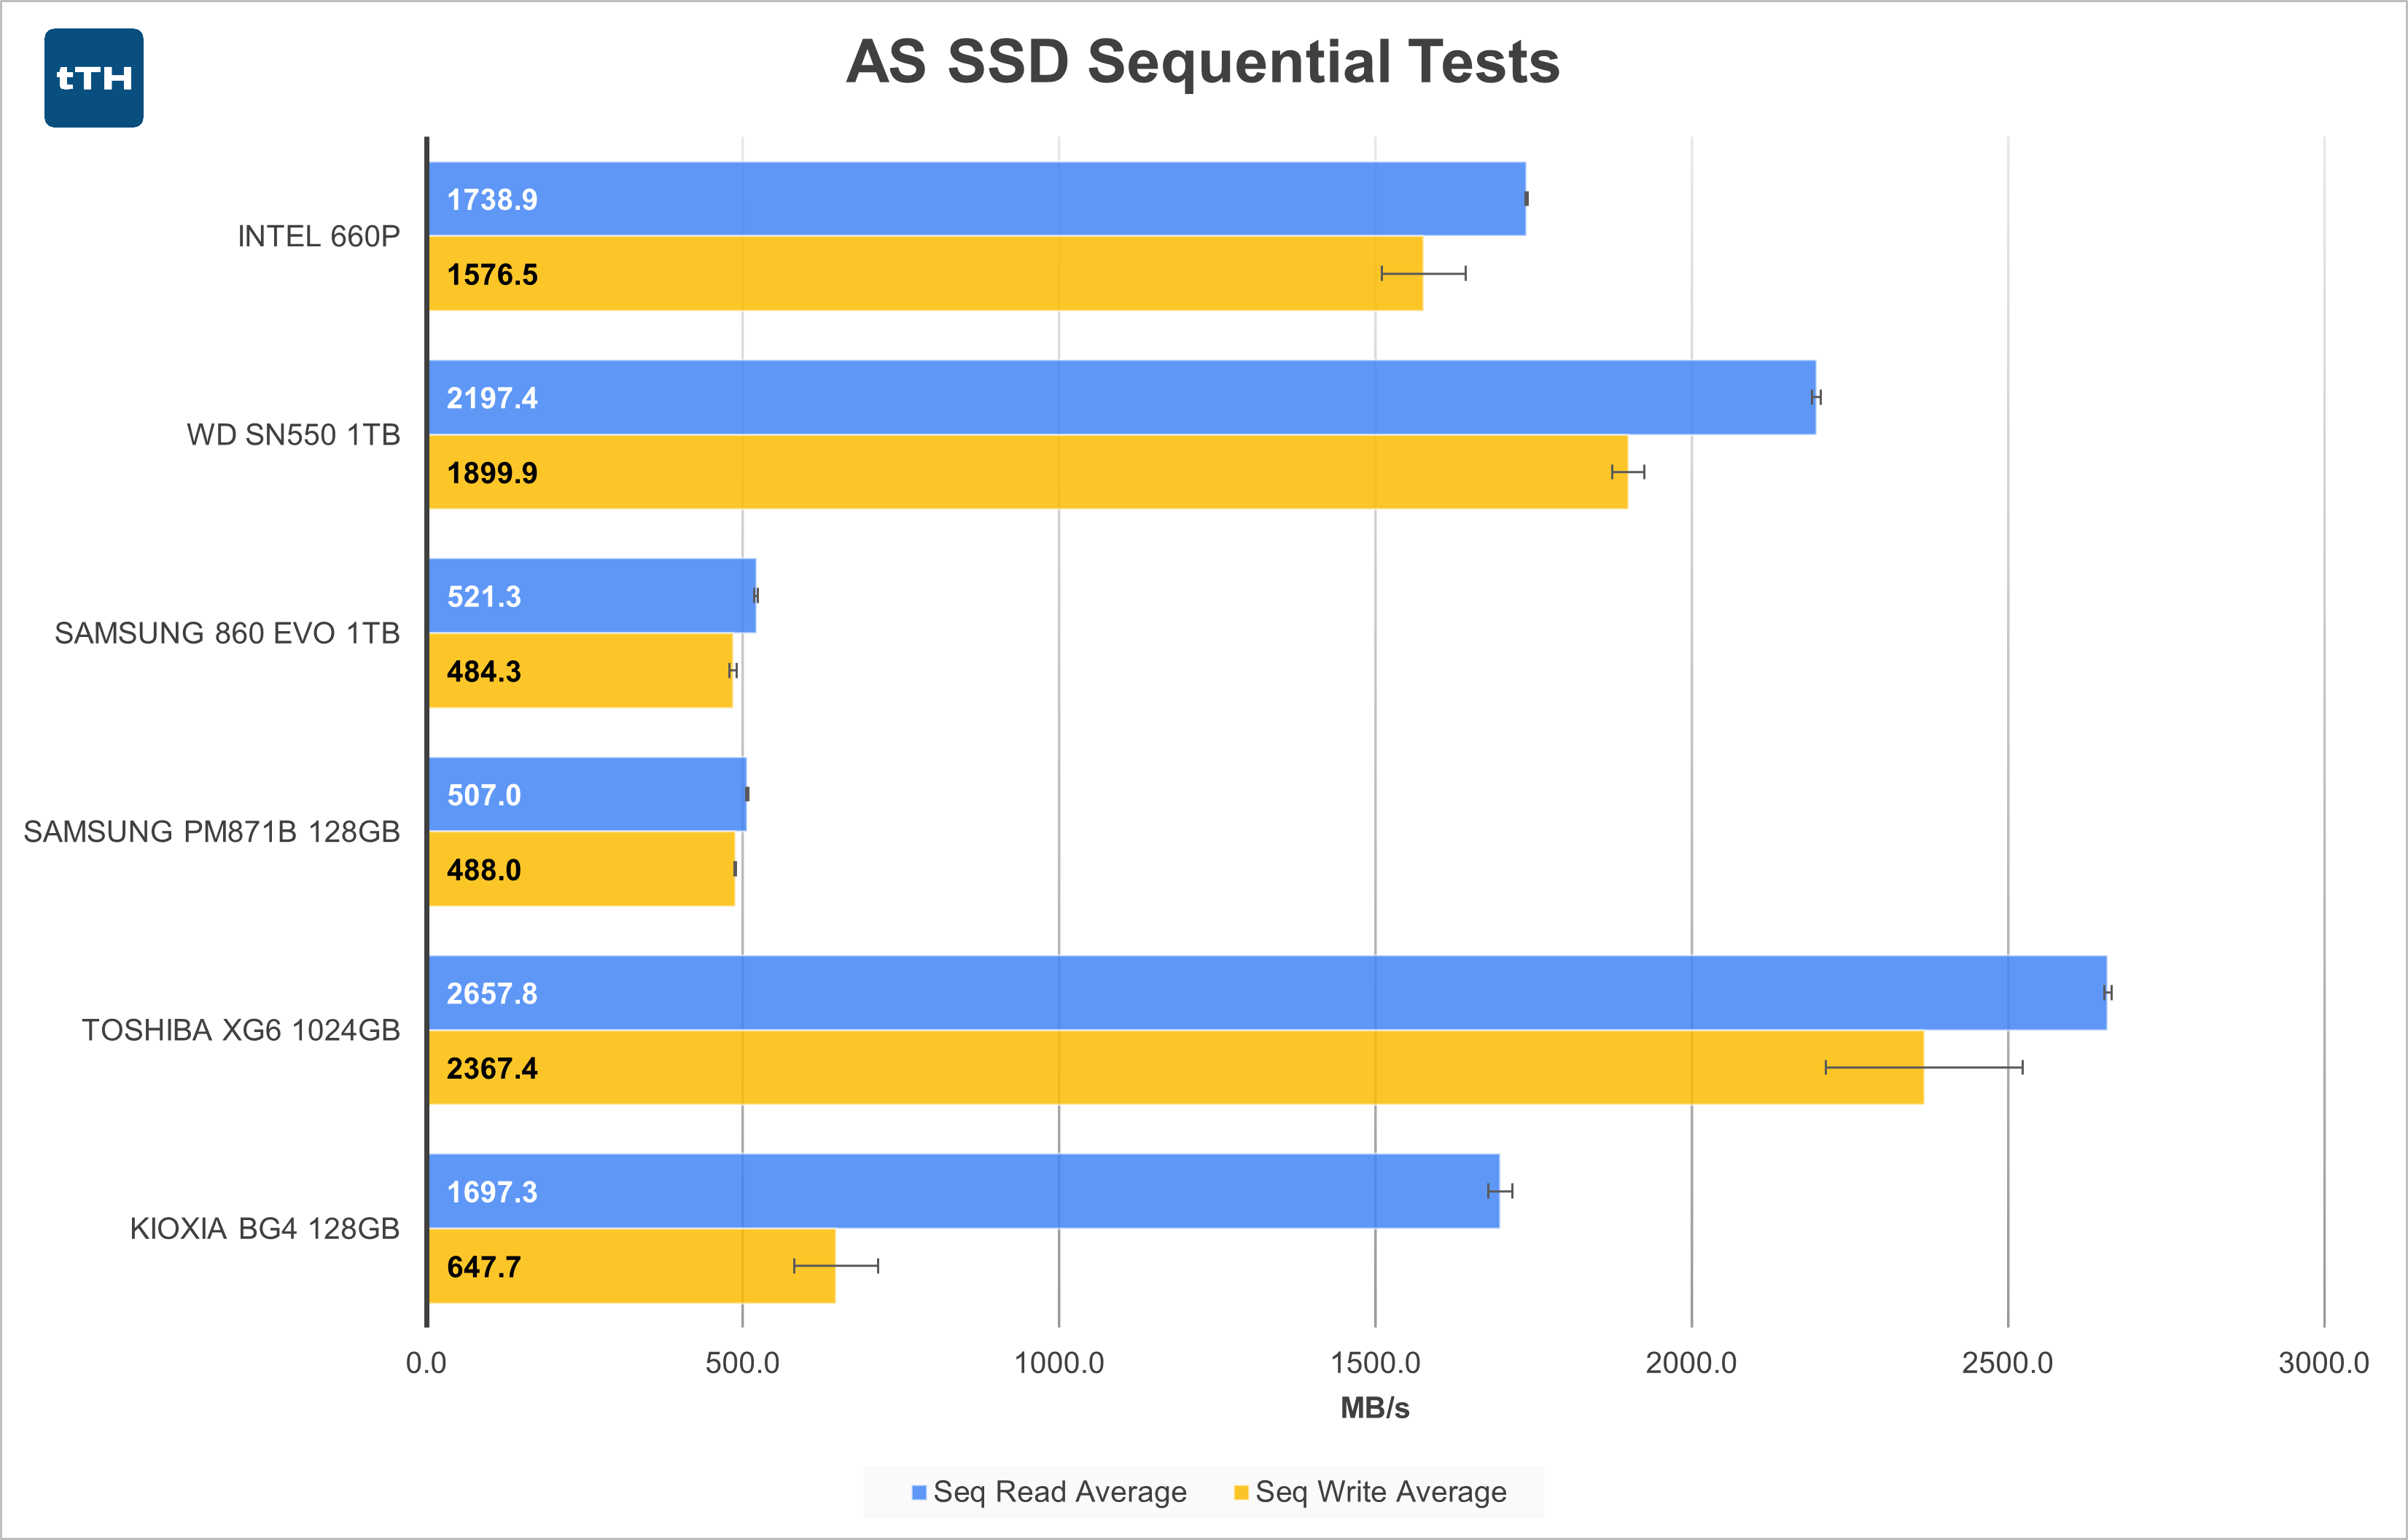 For sequential reads and writes, the 660p falls a bit behind the newer SN550, but at least for smaller 1GB chunks of data performance is still well in excess of what SATA SSDs can deliver. Longer writes on a mostly-full drive would yield lower results for the 660p, but that would be true for several of the other drives too.
AS-SSD 4K Tests
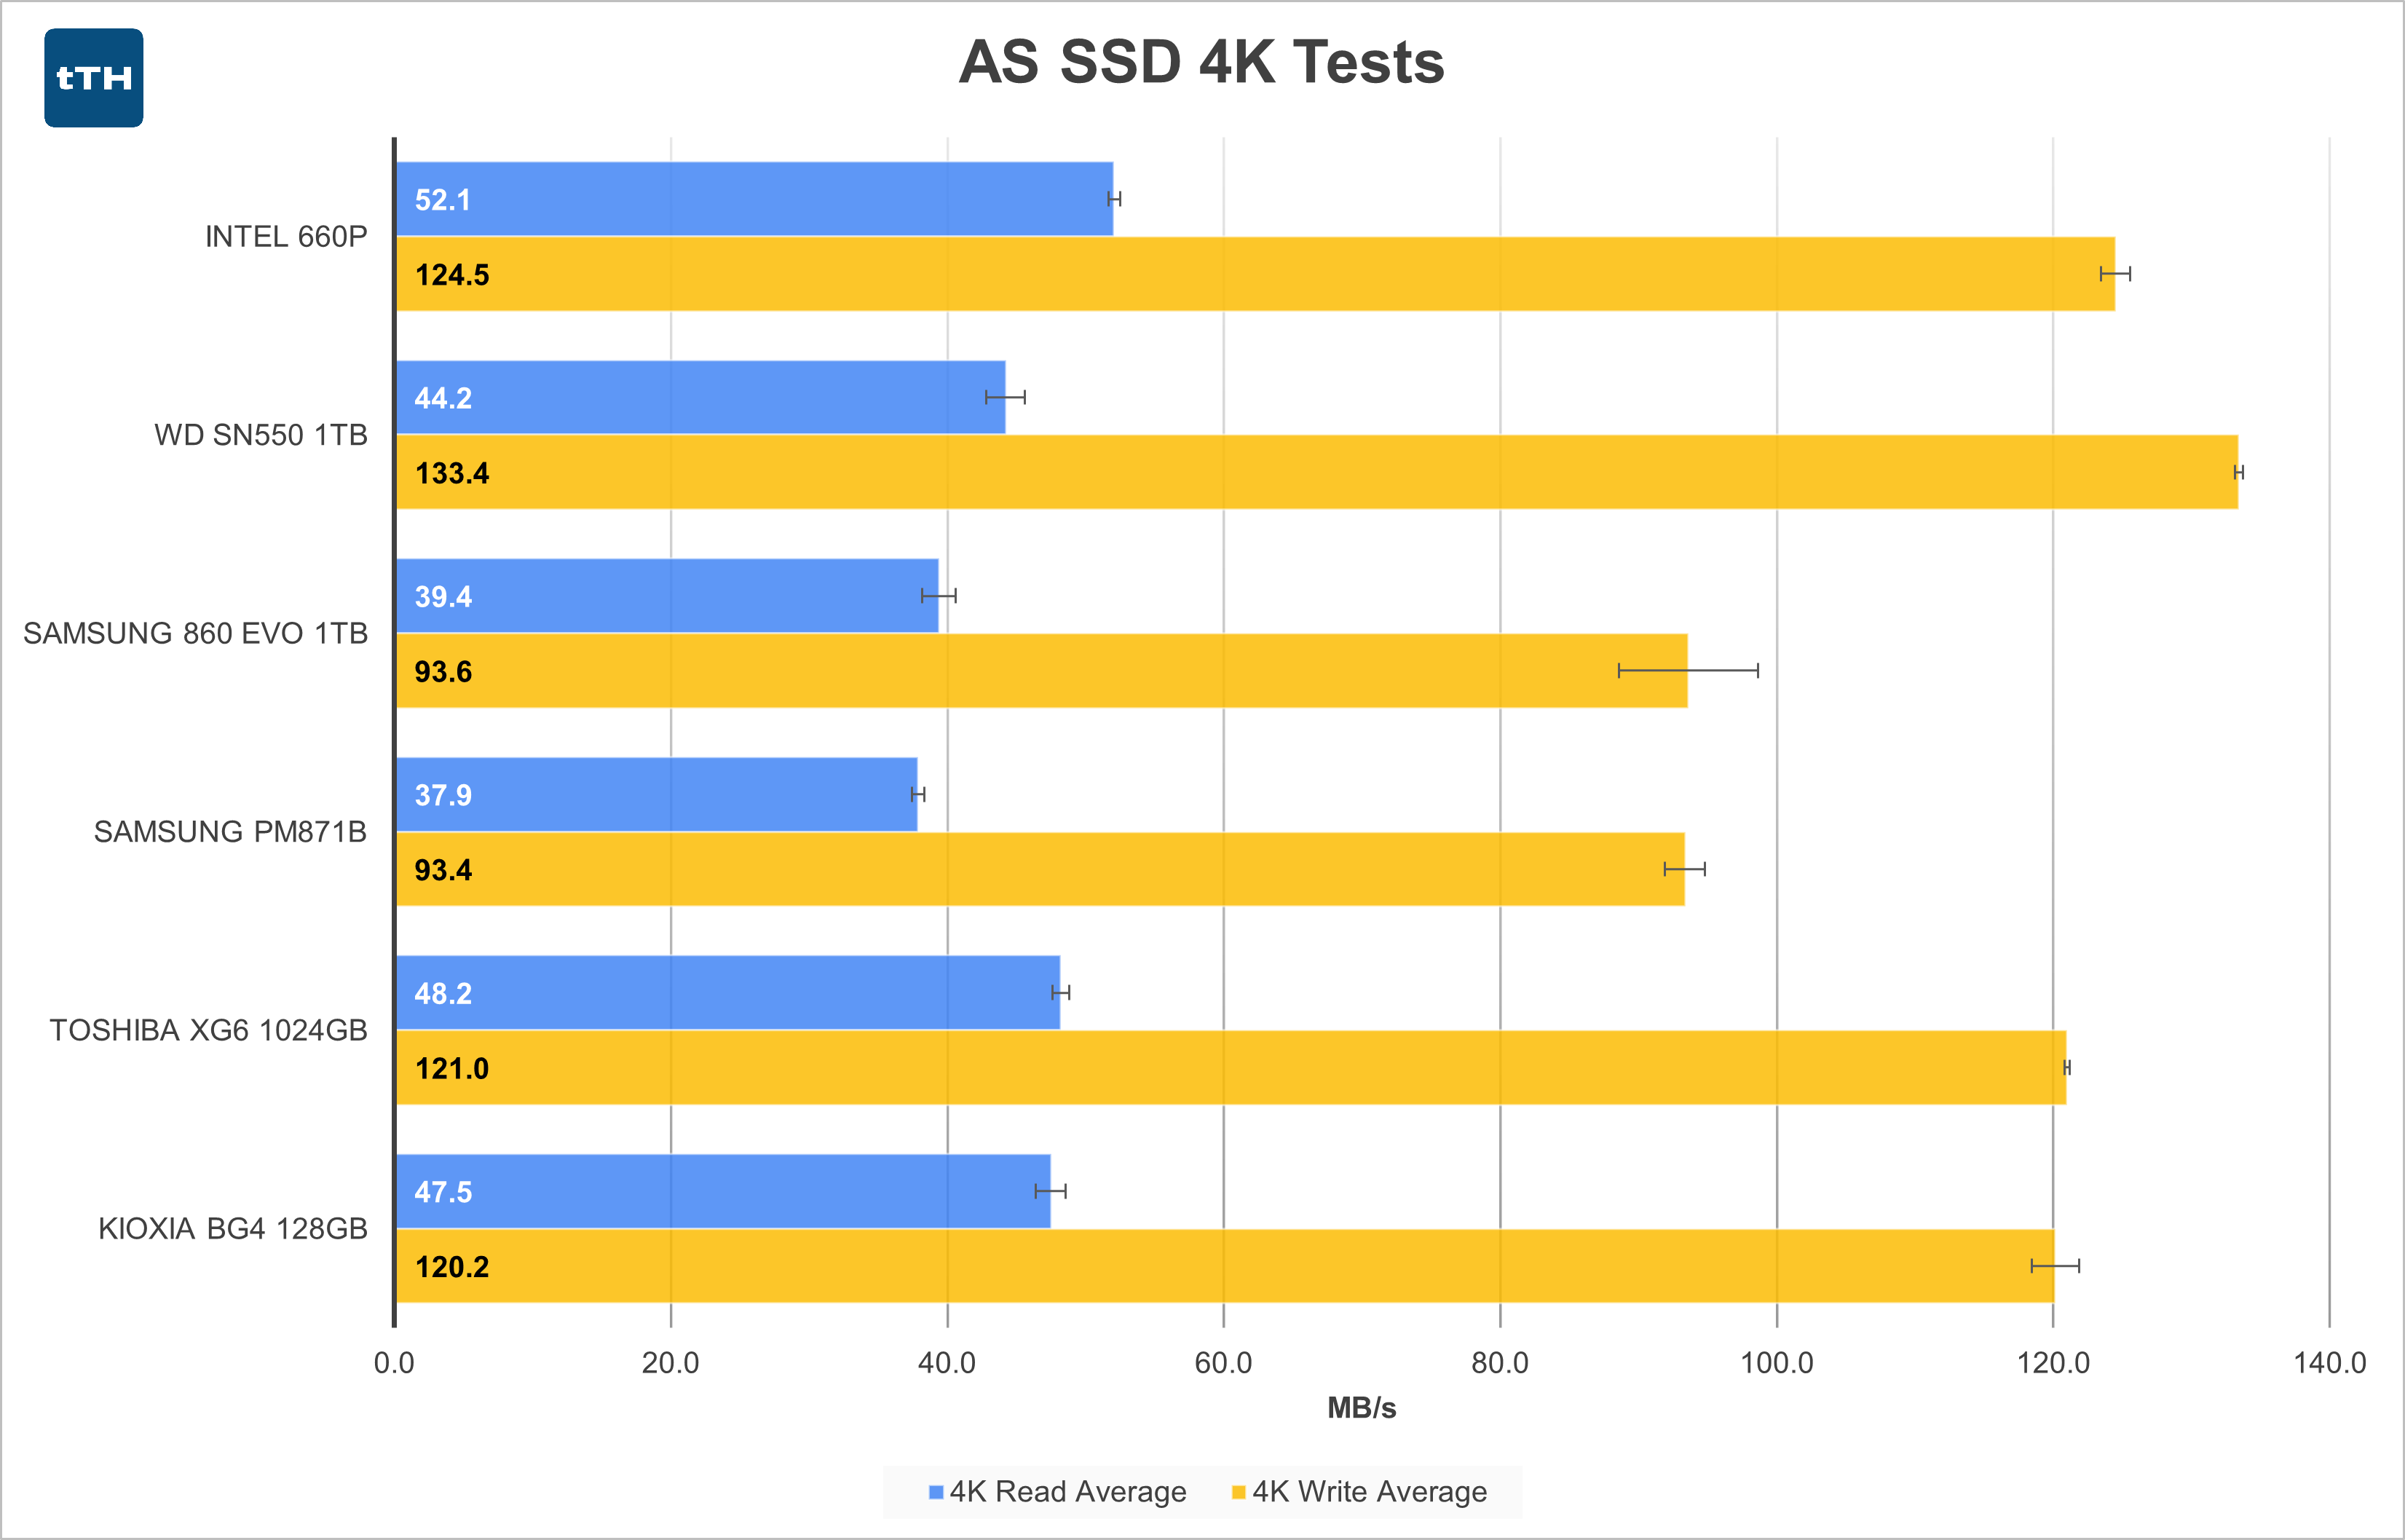 4K Read and Write performance on the 660p actually looks pretty good. It’s read speed is actually chart-topping in this metric and the write performance is in-line with the other NVMe drives in the comparison. This shows that the SM2263 controller has good 4K performance and isn’t being hampered by QLC… at least for the 1GB tests which fall within the SLC cache. I expect writes to suffer significantly once the cache is exhausted, but there really shouldn’t be any consumer workloads that need to write that much data in 4K blocks. For constant small writes, like a busy database, a QLC drive is definitely not ideal anyway due to endurance concerns, not just performance.
Based on these results, I’d expect the 660p to have relatively strong application performance - a theory that will be tested in the PCMark test that’s next.
PCMark 8 Storage Test
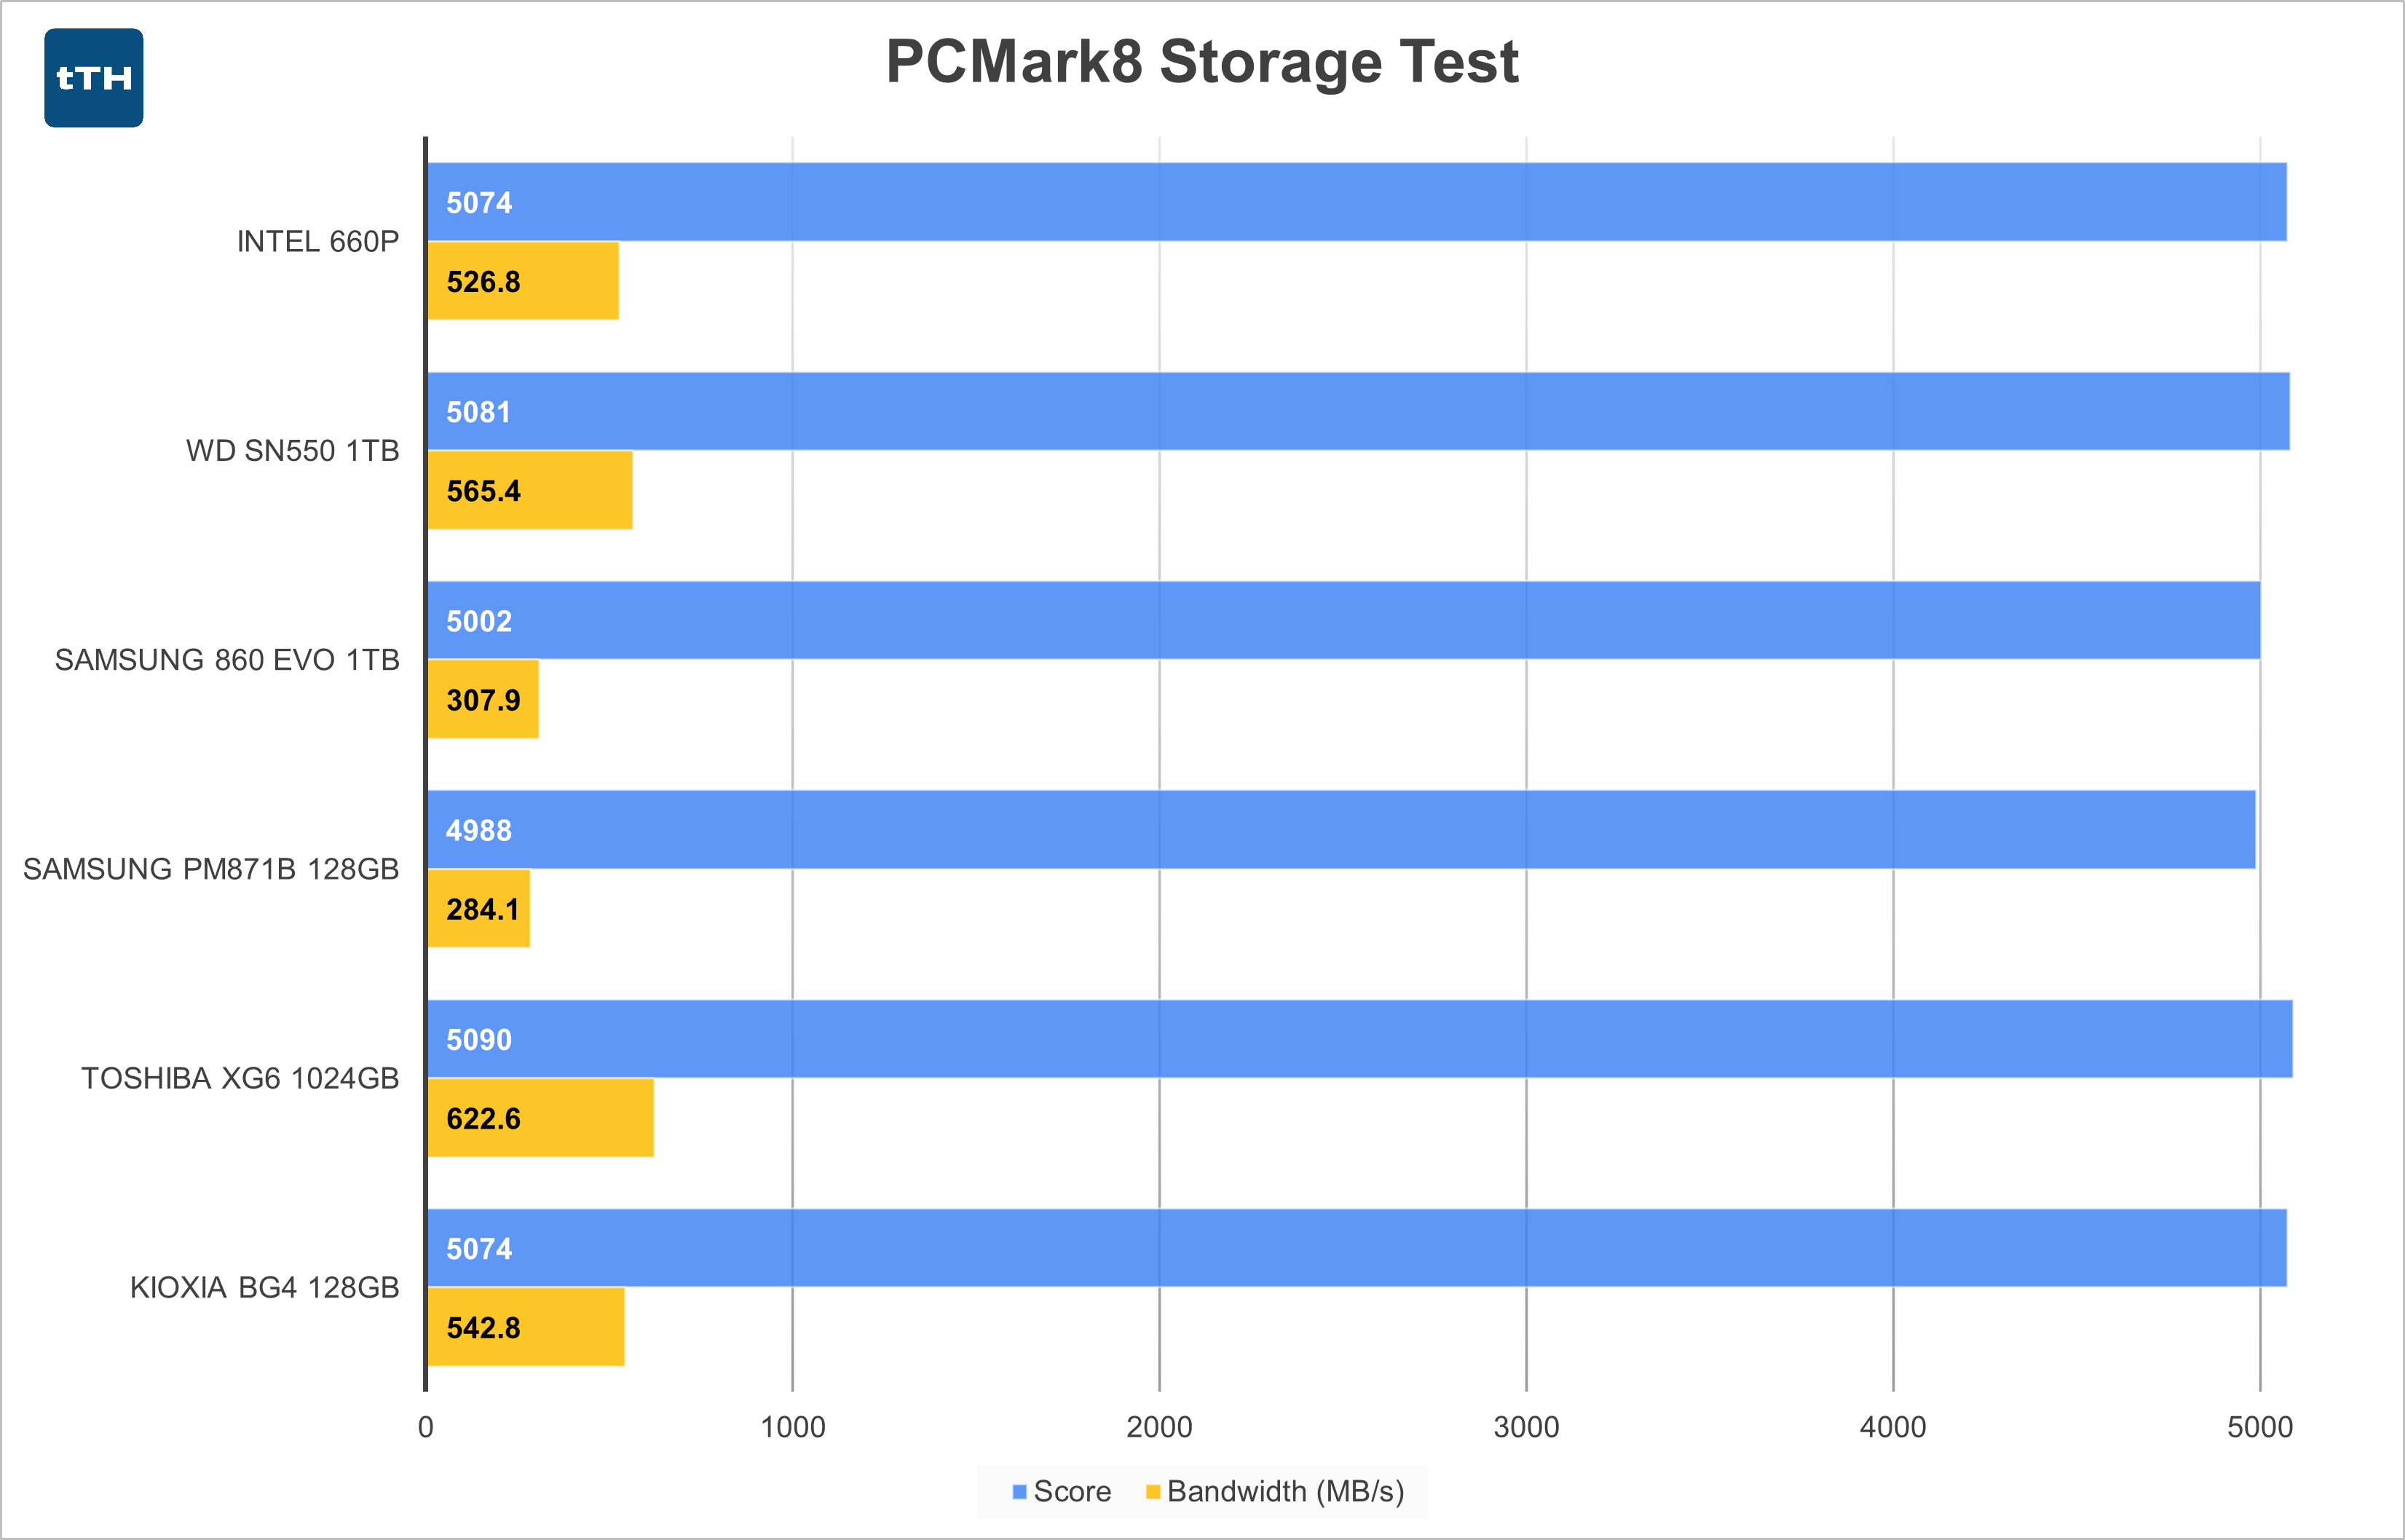 In PCMark’s Storage test the Intel 660p performs similarly to the other NVMe drives in overall storage bandwidth. It underperforms the 3D TLC based SN550 and BG4 drives slightly, but is definitely ahead of the SATA drives. The XG6 is about 18% ahead, but that’s to be expected when comparing an entry-level product to one that is definitely at least upper mid-range.
Large-File Transfer Tests
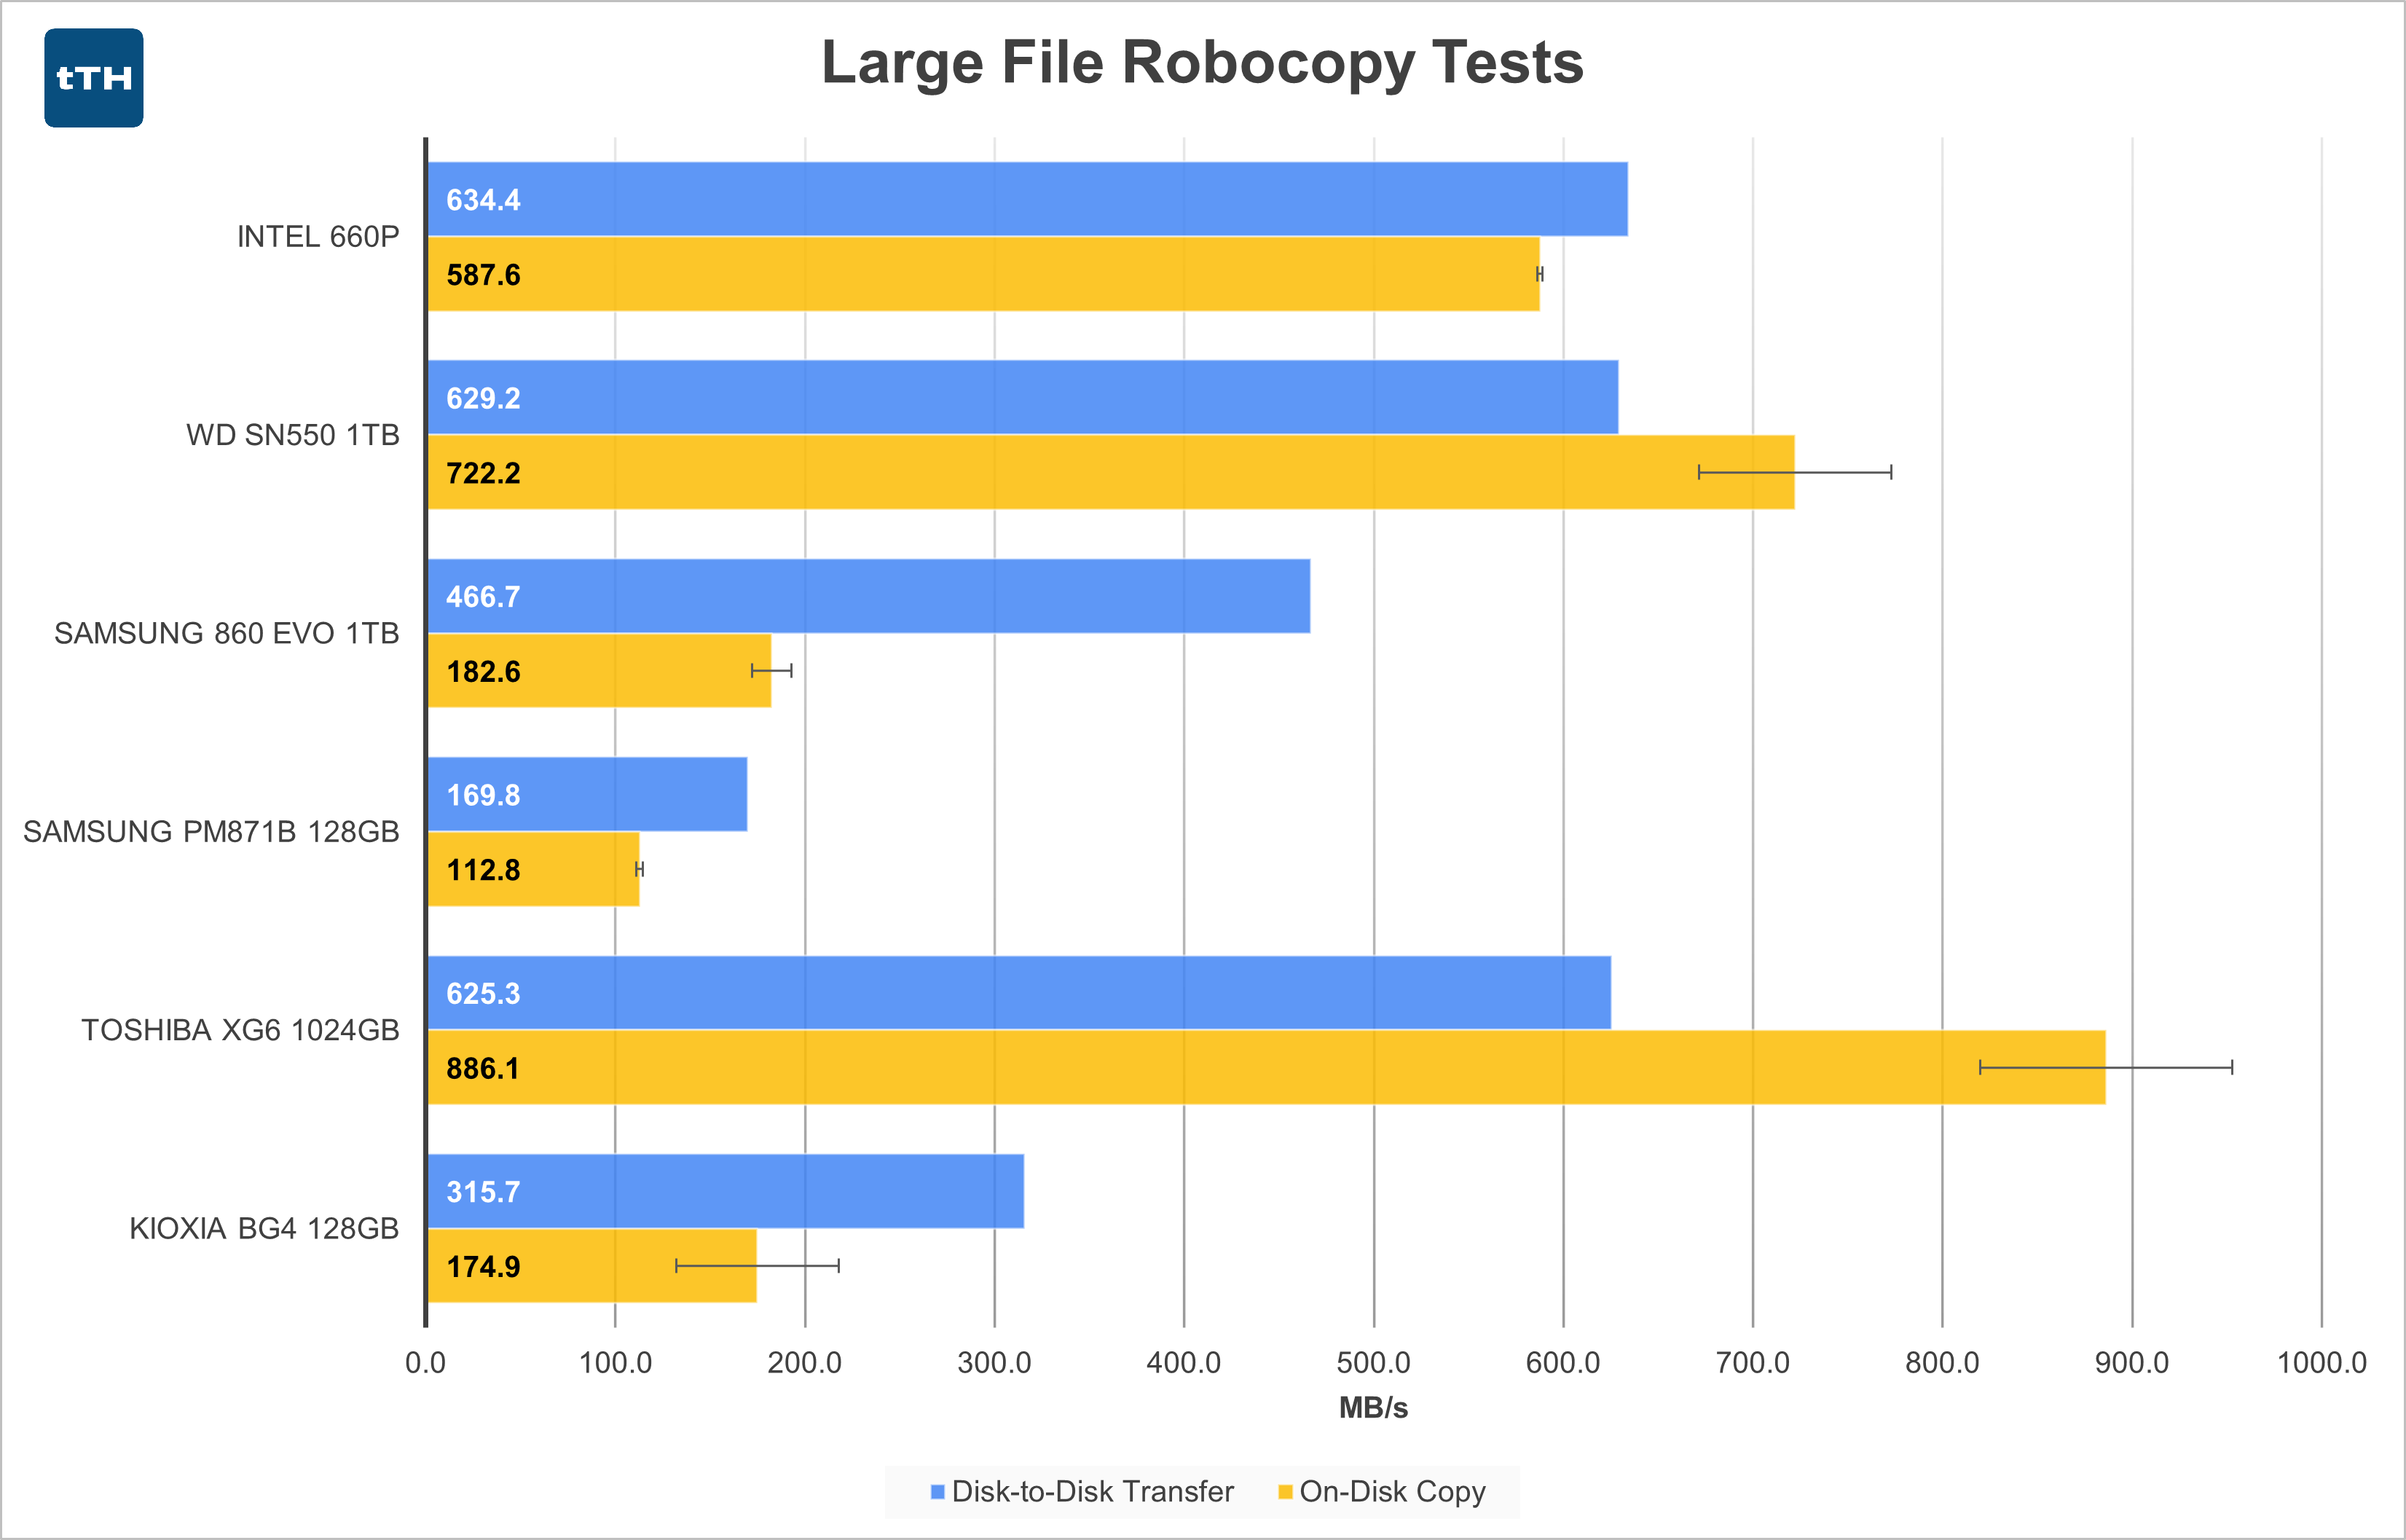 In case the disk-to-disk transfer numbers look a bit odd for the faster NVMe drives, recall that this test is a mostly sequential 30GB transfer from a read-source that peaks at 750MB/s. Unlike the 128GB drives that mostly don’t even peak at (let alone sustain) over 750MB/s, the faster drives are severely bottlenecked during the copy portion of this test as it can write at significantly greater than 750MB/s.
With that disclaimer out of the way, we see the 660p running up against the same ~630MB/s barrier that the other high performing NVMe drives hit on this test rig. It will likely show better performance when I transition to my v2 Testbed, though how much is up in the air. Unlike the other higher performing NVMe drives (not the BG4), the 660p shows lower performance in the on-disk copy test. This shows that when the 660p is busy both reading and writing it can’t quite deliver the level of performance of the faster PCIe based drives. Still, at least while operating in its SLC cache you can expect much better performance than possible with a SATA drive.
Small-File Transfer Tests
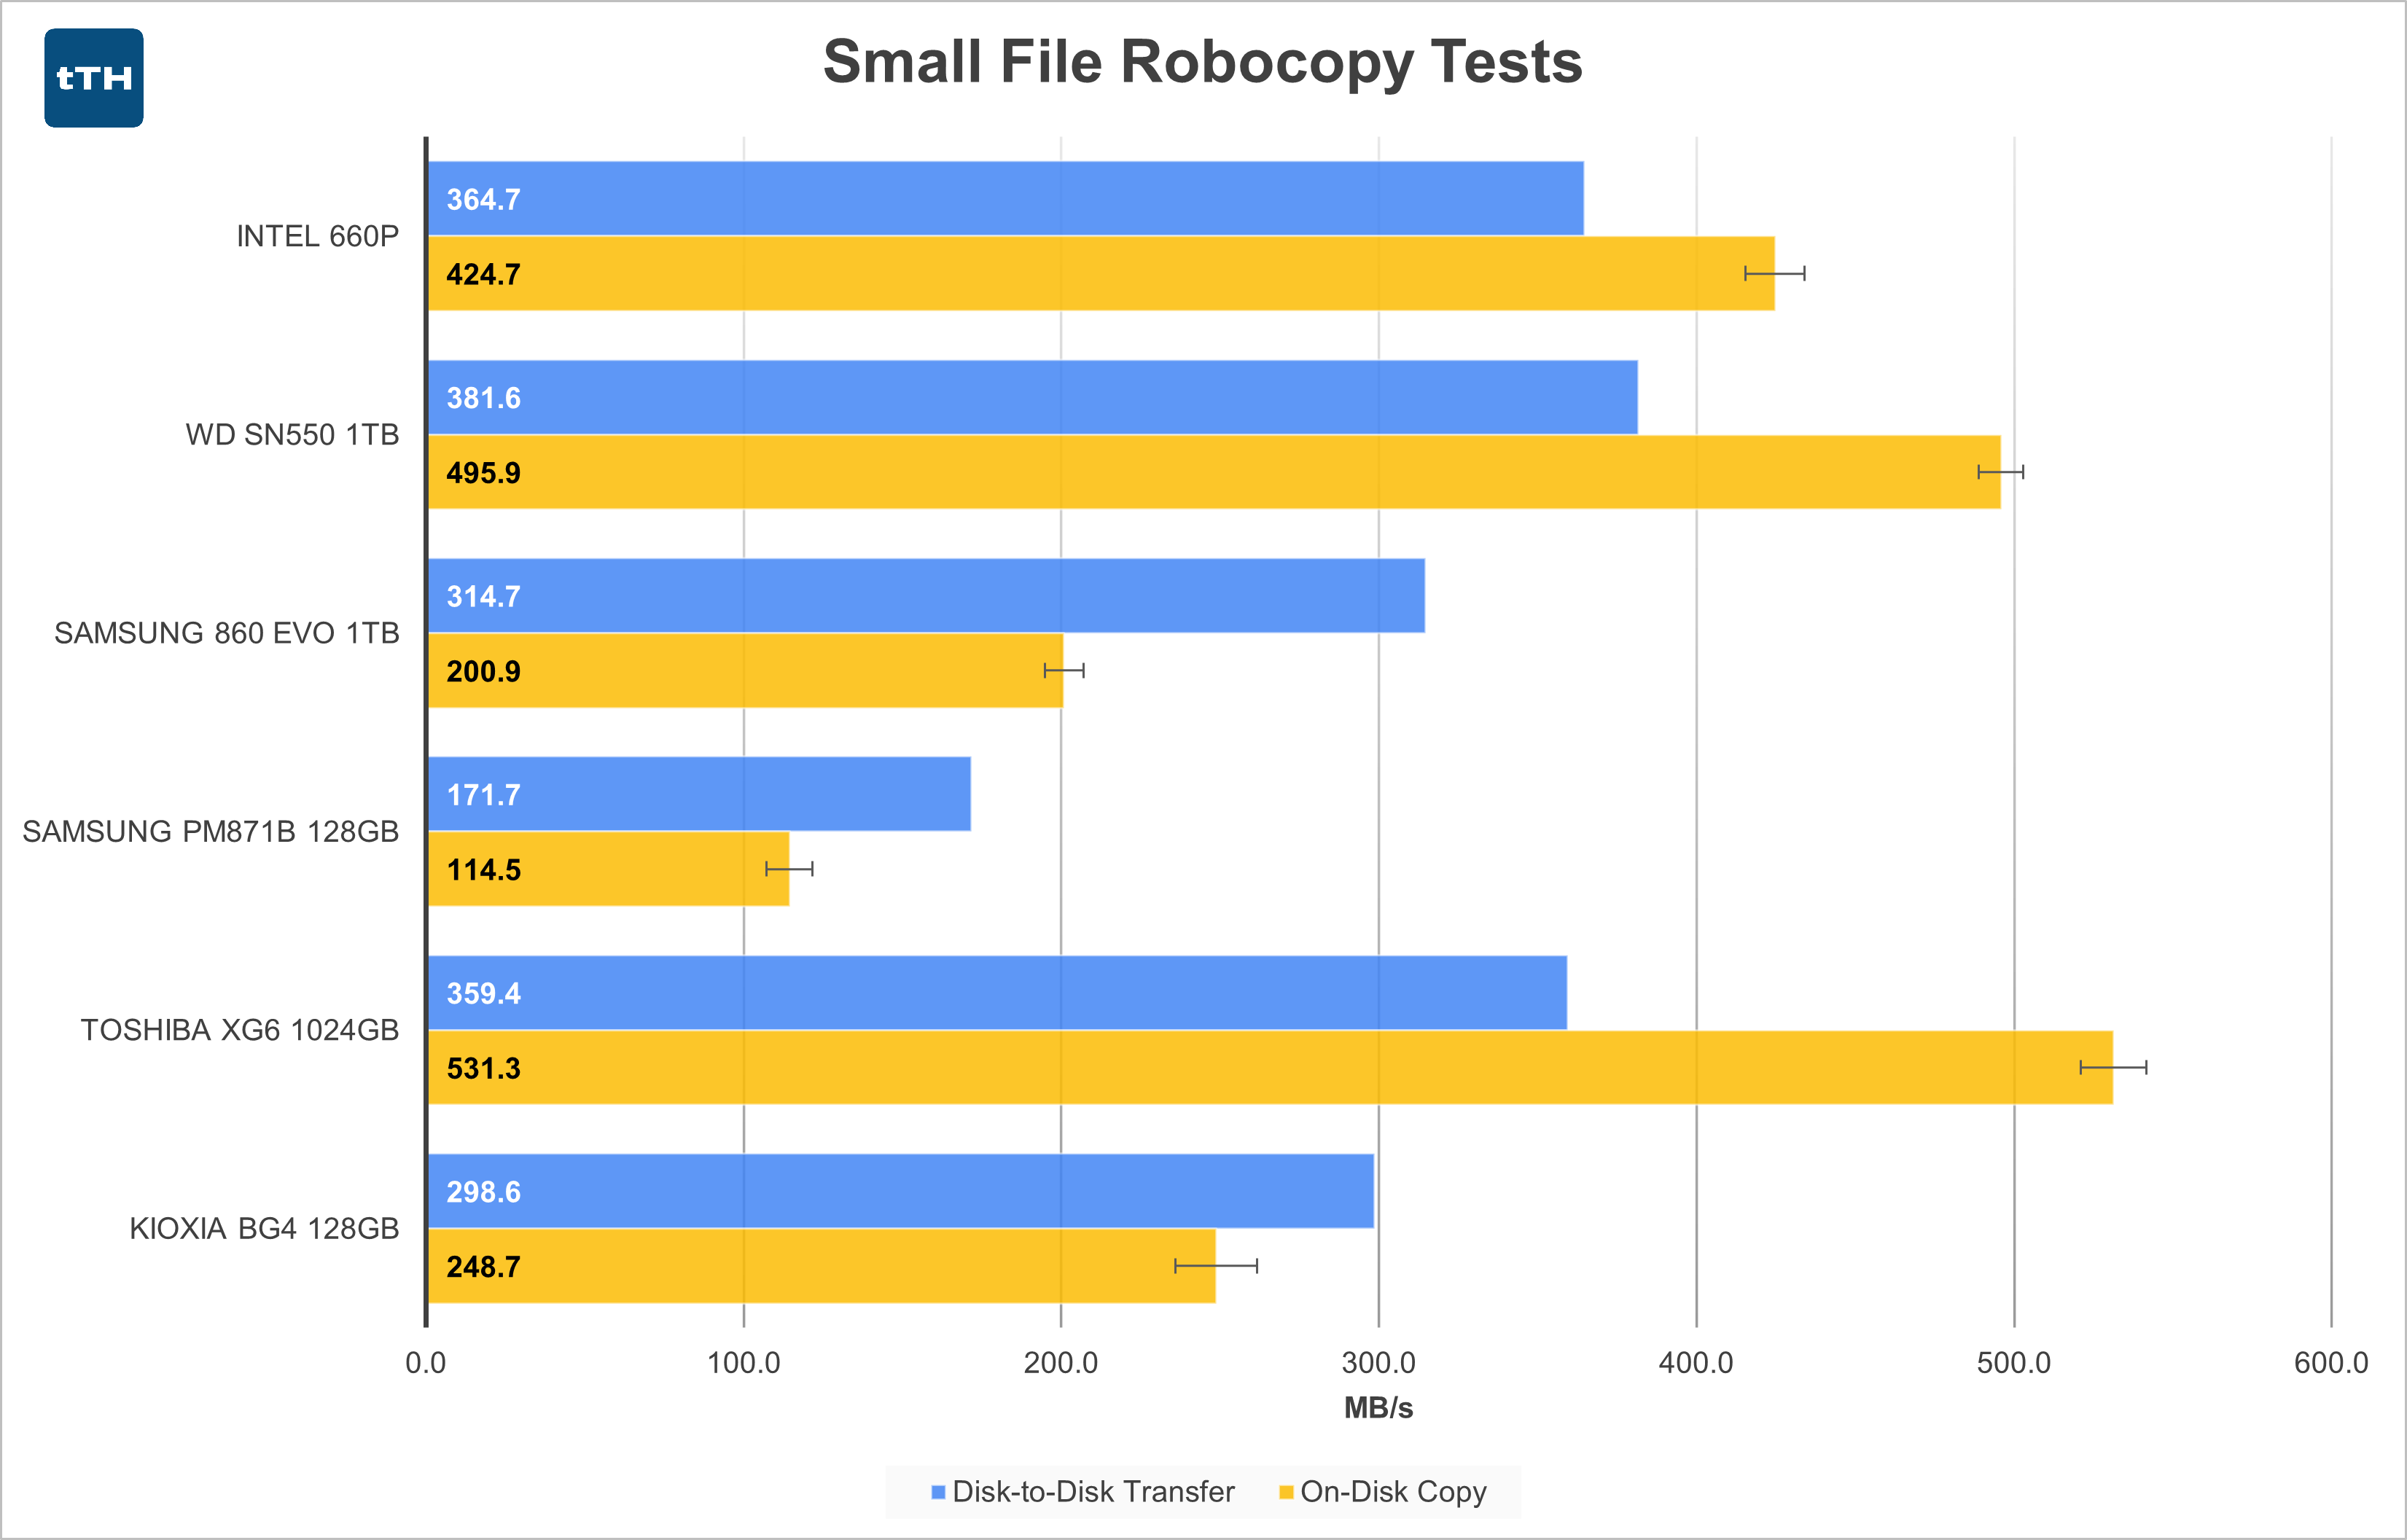 For the small-file tests the results for the 660p are even less interesting than they were for the large-file tests. The 660p is only slightly slower on the disk-to-disk transfer than the SN550 and delivers around 93% of the SN550’s performance in the on-disk copy. It still falls well behind the XG6 while still delivering more performance than SATA drives can. Not too shabby considering the SN550 is far newer and the XG6 is in a different market segment.
Conclusion
QLC-based NVMe SSDs appear to carve out a niche between high performance SATA SSDs and TLC-based NVMe drives. Previously, there was a relatively large price gap to go along with the performance gap and the 660p was designed to bisect both of those. In the performance sector it seems to perform this task relatively well, at least as long as you stay within the SLC cache. As for price, as I think history has already shown us, the 660p didn’t do so well. The price premium to get a better NVMe SSD was usually relatively low, and DRAMless TLC SSDs would trade blows in terms of cost and performance without the ugly stigma of low-endurance QLC.
A note on endurance. This is completely anecdotal and represents a datapoint of 1, but my 660p shows 4.67TB of writes but still shows 99% drive health remaining in AIDA64. Based on the 200TBW rating Intel gives the drive, it should really be closer to 98%, but still, this represents several years of “average consumer” usage. I expect that the drive would far outlive its usefulness before its NAND endurance was exhausted. Even my most heavily used drive (an MLC Samsung 960 Pro) only has 50TB of writes on it and I’m often creating, cloning, and destroying 30-60GB VMs (30-60GB of contents, not just 60GB partitions with 10GB of data on them) on that system as part of a normal workday. Though significantly slower, I wouldn’t be running low on endurance if I’d had a 660p instead.
What it comes down to is that QLC isn’t inherently bad. Performance is definitely lower than that of TLC or MLC, but its costs are lower and it opens up new usecases that weren’t available with TLC. There are now consumer grade 16TB SATA SSDs and 8TB M.2 NVMe SSDs. Though outrageously expensive by consumer standards, these are still far cheaper than their high-capacity enterprise counterparts that could easily cost an order of magnitude more. Enthusiasts and prosumers will want to avoid QLC drives for now, but those groups have always been willing to pay extra to get a bit more than average consumers. And that’s precisely who QLC drives are aimed at, average consumers. QLC may be slow, but for the vast majority of usecases they’ll still be significantly faster than the spinning disks still found in bottom-tier consumer PCs. Ultimately, those are the drives that QLC is intended to replace.
We may get a little touchy about the industry seeming to completely kill off MLC, replace it with TLC, and then add QLC to the bottom of the stack. But all of this has happened before (with SLC being killed off, MLC taking its place, and TLC being added to the bottom) with basically everything turning out OK in the end. Sure, there were definitely some dud drives that used the new technology, but in most cases, as long as you did some research you could avoid getting a bad drive and not have to spend too much more than bottom dollar anyway. That remains true today with QLC. What remains to be seen is if all of this will happen again (with PLC) and whether everything continues to be OK.