What's Taking So Long? Or, the perils of an enthusiast making a test suite from scratch.
The trials and tribulations of rolling your own benchmark suite.
Hello again
In my previous post: Testbed v2 Update I stated that more content would be coming. I’d planned to retest everything already tested on Testbed v1 on my new Testbed v2 using a modified version of Methodology v1 that I’d dubbed Methodology v1.1. The details are in the aforementioned post. This task sounds pretty straight forward, yet here we are approaching 4 months later and there’s no new data to show. Notably, sometime between June 6th and the time of this writing in Sept, the 1 year anniversary of me starting this crazy SSD testing adventure passed without as much as a stray thought. So, what gives?
I can’t blame just one thing. The most honest single answer is “life”. I’ve been busy and haven’t had the wonderful convergence of time, energy, and motivation to work on this project enough to get the ball rolling. It’s no small feat to run a couple hours of tests on 20 different drives, even if the majority of the work is just babysitting it from test to test and then swapping out drives.
That said, I’ve also run into a few technical hurdles that had me getting nonsensical data, retesting for days, tearing out my hair, and throwing away large swathes of data. I eventually decided to put my thinking cap back on to figure out what was going on. It’s this process I intend to expand on today. Ultimately, while showing my dataset of numbers might be mildly interesting, a deeper investigation into some of the factors that yield these results might technically be more valuable.
Setting the Stage
I started gathering test data on two of the faster NVMe drives on June 6th, the same day I published my little Testbed v2 Update blurb. I was hoping that I could publish a teaser for some initial results by the end of the day or in the next few days.
For essentially all of my published results to date I’ve gathered all the data in one or more testing sessions, dumped it into a spreadsheet, and then only after collecting the all of the data would I generate graphs and start to piece together a narrative of what the data showed. This helped me assembly-line the process of producing reviews and made it so that I could test a bunch of drives and not feel obligated to immediately write up the results. Plus, I felt that this was a more honest approach. Sure, I had some preconceptions about what results I was expecting for a given drive, but by collecting the data entirely beforehand, I felt I was eliminating potential for bias.
Boy am I glad that I didn’t wait to retest all 20 drives on Testbed v2 before looking at the data.
In my initial round of v1 tests, whether looking at the most consistent or least consistent drives, there was some level of expected run-to-run variance for the data for a given drive. That’s why I captured multiple runs of data and presented it as averages of the accumulated runs with error bars indicating +/- 1 standard deviation.
Looking at the raw, unaveraged data for the same drive, in the same test, with the only variation being a different testbed, I saw data that just made no sense:
| Inconsistent Data Pt 1 | |||||||
|---|---|---|---|---|---|---|---|
| Run 1 | Run 2 | Run 3 | Run 4 | Average | StdDev | StdDev as % of Average | |
| Testbed v1 | 624.4 MB/s | 627.4 MB/s | 620.8 MB/s | 628.5 MB/s | 625.3 MB/s | 3.5 MB/s | 0.55% |
| Testbed v2 | 358.7 MB/s | 943.3 MB/s | 929.5 MB/s | 925.5 MB/s | 789.2 MB/s | 287.1 MB/s | 36.4% |
For what it’s worth, the drive in question is the 1TiB Toshiba XG6 and the test data is from one of my scripted Robocopy small-file disk-to-disk transfer tests. Based on what I’d seen in the v1 tests, the drive provided pretty consistent performance of around 625 MB/s, but was clearly being held back by the bottlenecked read speed of the origin drive due to the limitations of the Testbed v1 hardware.
Testbed v2 was supposed to alleviate that bottleneck, so I was expecting a higher average speed than what was achieved on Testbed v1. And a higher average was what the data indicated, but the standard deviation was WAY OFF. The first run was unexpectedly slow, but subsequent runs were both inexplicably fast and inexplicably consistent.
Had this just happened once, I might have chalked it up to some background tasks slowing down the source disk for Run 1 and the rest of the data were accurate, but I saw the same type of results on the large-file transfer tests for the XG6 as well. Moreover, I saw similar results on the 512GB Samsung PM981a that I’d already gathered test data for as well.
So I retested. Once, twice, thrice. Thankfully, based on retesting, I was able to confirm that the v2 Run 1 datapoint WAS erroneously low. However, even with retests, the trend remained where Run 1 was clearly separate from the performance of the subsequent runs. There was something going on, but what. The astute of you are probably jumping out of your seats, waving your hands, and yelling at me through the computer screen, but I hadn’t figured it out yet.
I worried that a firmware update had changed the performance characteristics of the drive, but I was able to confirm with some screenshots that my drive’s firmware was the same in June 2021 as it was in late 2020 when I gathered my v1 data. I also worried that I’d gotten my two XG6’s mixed up and performance was somehow different between the two drives due to parts swap shenanigans (that’s been in the news as of late). I didn’t really suspect that, but I had to check to make sure. Neither of my XG6s was particularly new and they’d been manufactured relatively close to each other. So I went through the hassle of cloning the boot drive on my main rig to my test WD Blue 1TB and extracted the second XG6 from the back of of the ITX board in my pain-to-work-on main machine. This let me put my fears to rest, but ultimately didn’t tell me anything of substance. The performance of my two XG6s were within margin of error of each other.
A theory is born
I was running out of ideas. It was time to start questioning my assumptions. The behavior looked like caching… but why would I be seeing that on the new testbed and not the old testbed? It hit me like a ton of bricks. Robocopy isn’t a benchmark using randomly generated data, it’s a real tool. I explicitly used it for just that reason. Over the years Microsoft has done all kinds of things to optimize Windows to be faster and more efficient (yes, they’ve also added a lot of bloat, but I’m not going to touch that one).
My new testbed has 64GB of RAM. My test datasets are 7.4GB and 29.7GB respectively. Those both easily fit inside of 64GB of RAM, even with a running OS. They really didn’t fit inside of the 16GB of RAM on the old testbed with 16GB of RAM (more on that later).
Could it be that Windows was caching the whole dataset and after the first copy, all subsequent copies were simply read from RAM instead of the source disk? It’d explain the results.
I now had a viable theory.
Time to test
After performing the Robocopy ~29GB large-file copy, the Task Manager doesn’t show significantly more RAM usage, showing ~7GB used compared to ~5GB after a clean boot:
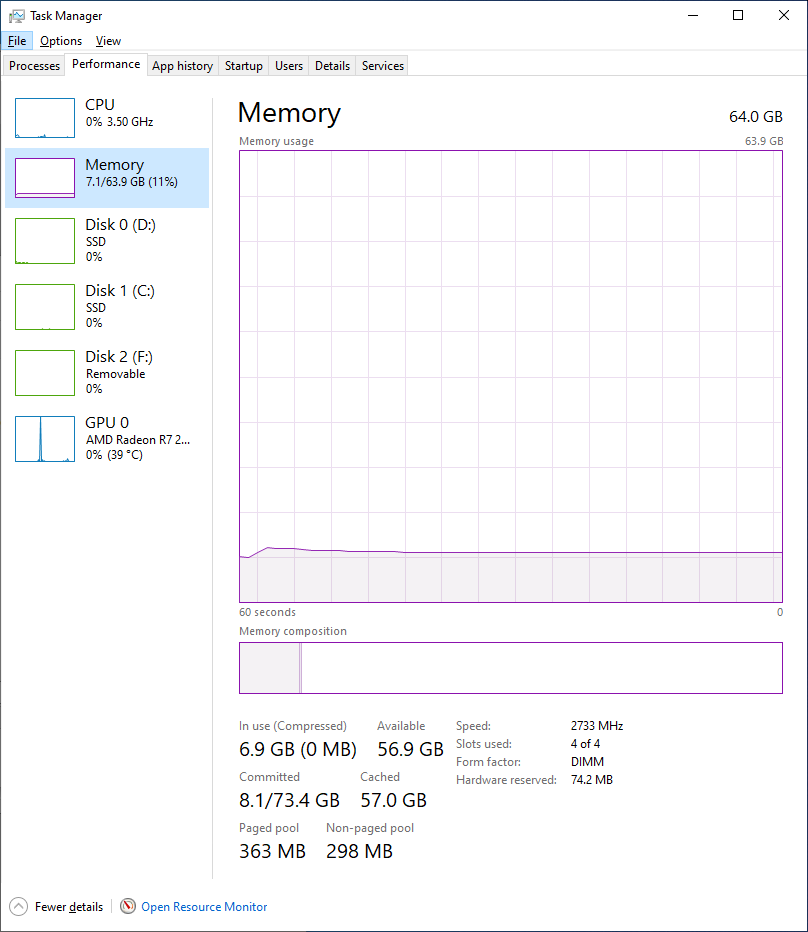 The Commit Charge wasn’t sufficiently large to account for caching either, so at least the issue wasn’t something blindingly obvious that I’d somehow missed. But I knew from other experience that the Task Manager sometimes lies about memory usage. Time to dig out some heavier duty tools, namely RamMap from Microsoft’s Sysinternals.
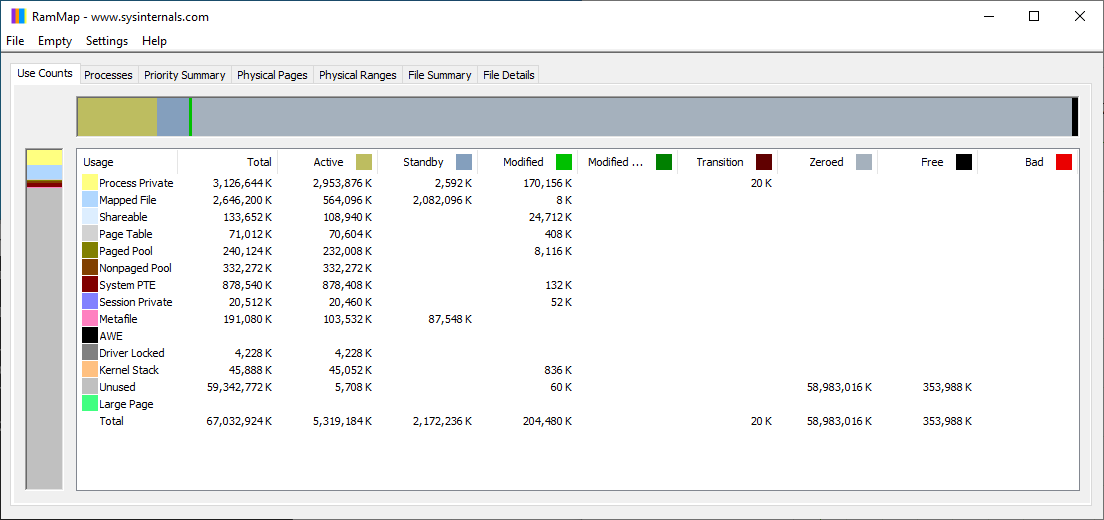
On a freshly booted system, RamMap looks like this:
After performing the 29GB Robocopy test it looked like this:
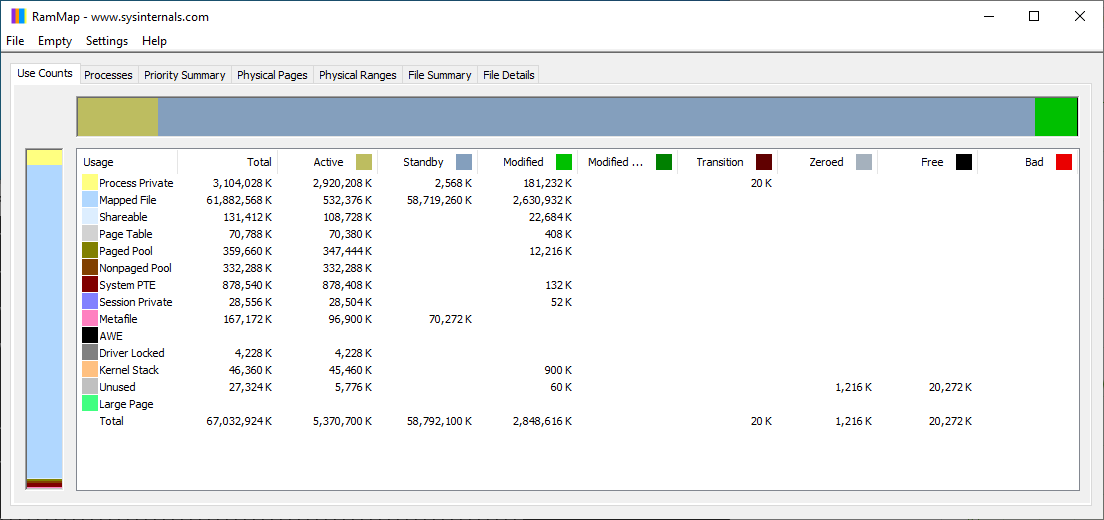
Windows has a whole lot of SOMETHING in RAM that it didn’t have before the copy. It’s a bit perplexing that it’s nearly twice as much data as was copied. I don’t know enough about how Windows stores disk cache, and deep-diving into the topic was well outside the scope of my end goal, but the evidence was piling up.
Theoretical Fix 1
I tried to see if I could get Robocopy to perform the data transfer without using the cached data. The flag “/J” for unbuffered I/O looked roughly in-line with what I was looking for, but I doubted it was the correct approach. Tests confirmed my suspicion: it mostly resulted in terrible performance.
Moreover, even if using /J fixed the issue, this would be a further departure from Methodology v1.0 which would make the results even less comparable. The whole point of retesting all the drives on the new Testbed using the same methodology was to attempt to isolate the impact the platform change had on the tests. If the tests were no longer comparable, I might as well just move on to drafting and testing my next generation of test methodology.
Theoretical Fix 2
My next thought was that maybe I could get Windows to clear its disk cache between runs. I found a tool on wj32.org called EmptyStandbyList.exe that could easily be run from the command line or, more importantly, from a batch script like the one I used for automating my Robocopy tests.
I performed some trials with the 29GB dataset, again starting with a clean boot.
Run 1 - Clean boot Robocopy performance: 1051.0 MB/s
Run 2 - Presumed cached Robocopy performance: 1684.7 MB/s
Run 3 - Cleared Windows Standby Memory performance: 1040.0 MB/s
So, Windows is definitely caching the data being copied, nullifying the benefit of running multiple iterations of each test to get statistically better data. Great.
Now what?
The kneejerk response to the caching finding was to incorporate running EmptyStandbyList.exe into the Robocopy batch script. But after pondering this for a minute I realized that this would result in the same issue as I pointed out would have happened if Theoretical Fix 1 had been the fix: I didn’t do this as part of my v1 test suite, and doing so now would make the results incomparable. I also wasn’t going to go back and repeat the v1 tests on the v1 testbed. I bought and built a newer testbed to move forward. Running EmptyStandbyList.exe would definitely be a good addition to the Methodology v2 overhaul, but that’s still in the planning phases and doesn’t solve the problem at hand.
This realization also made me realize that caching had impacted my v1 tests, though to a lesser degree. The size of the test datasets meant that not all of the copied data could be cached, but that didn’t preclude some of the data from being cached. Additionally, the small Robocopy test would be disproportionally affected compared to the larger Robocopy test due to how much of the test could be cached for the additional test passes. Again, this is interesting and maybe concerning, but not a solution.
Have you figured it out yet?
If, after reading this article this far, you still remember what I discussed in my Testbed v2 Update, you might already realize how I decided to fix the issue. In the previous post I’d already mentioned that I wanted to do some tests using a RAM Disk as the read-source to eliminate any storage bottlenecks in future testing. I realized that, even when not actually using the RAM Disk for testing purposes I could use one to ensure that RAM was in use and not available for Windows caching. I allocated 48GB of RAM to a RAM disk so as to leave my 64GB system with only 16GB of RAM. After the OS loaded, this should be pretty close to the RAM usage on the old testbed. Sure, this probably isn’t exactly the same amount of RAM that was free on my old testbed, but I also didn’t have a great way of figuring out how much free RAM that system had when I was testing. But as far as I’m concerned, with as long as this has taken, this is close enough. The difference in the amount of cached data between the two environments should be in the ~100MB range, not tens of GB.
Conclusion
So this is as far as I’ve gotten. All the testing, theorizing, and retesting has taken several months. It doesn’t help that I’ve only averaged working on the project one weekend per month. Since putting all of the pieces together I haven’t gotten around to actually sticking all the drives back into the system and hitting “GO” on all the tests, but at least I’m no longer blocked.
When will the follow up piece(s) come out with all the new data testing the original drives on the new testbed? I’m not sure. Not today. Not this week. We’re far enough through September that I can safely say not this month either. Maybe by Halloween?
It’s a lot of testing, though now that’s no longer what I’m worried about. I’ve never reviewed more than a handful of drives at a time. Now I’m talking about testing 20. And I need to compare the results for 20 drives on the old testbed to the new testbed.
Collating that much data and trying to present it in a sensible, readable manner is not a job I’m looking forward to tackling. Speaking impromptu as I type these words at nearly 2AM, my best thought is to break this down by segment. One article each for high-end NVMe drives, low-end NVMe drives, and SATA drives. Still daunting, but certainly more manageable. But that’s a problem for future me.
If there’s anyone still reading this, I hope this has been interesting and I wish you the best.
Cheers!